Mapping Chart of Accounts
Financial Reporting
Once you connect your accounting software to Calqulate, your Chart of Accounts (CoA) will be imported.
Mapping your chart of accounts is the single most important step in setting up an automated finance stack. Your business generates revenue and expenses during its daily activities. A properly mapped chart of accounts allows this data to flow automatically to the correct place in your Profit and Loss and for staff costs and expenses to land in the right departmental cost centre.
How to map your Chart of Accounts
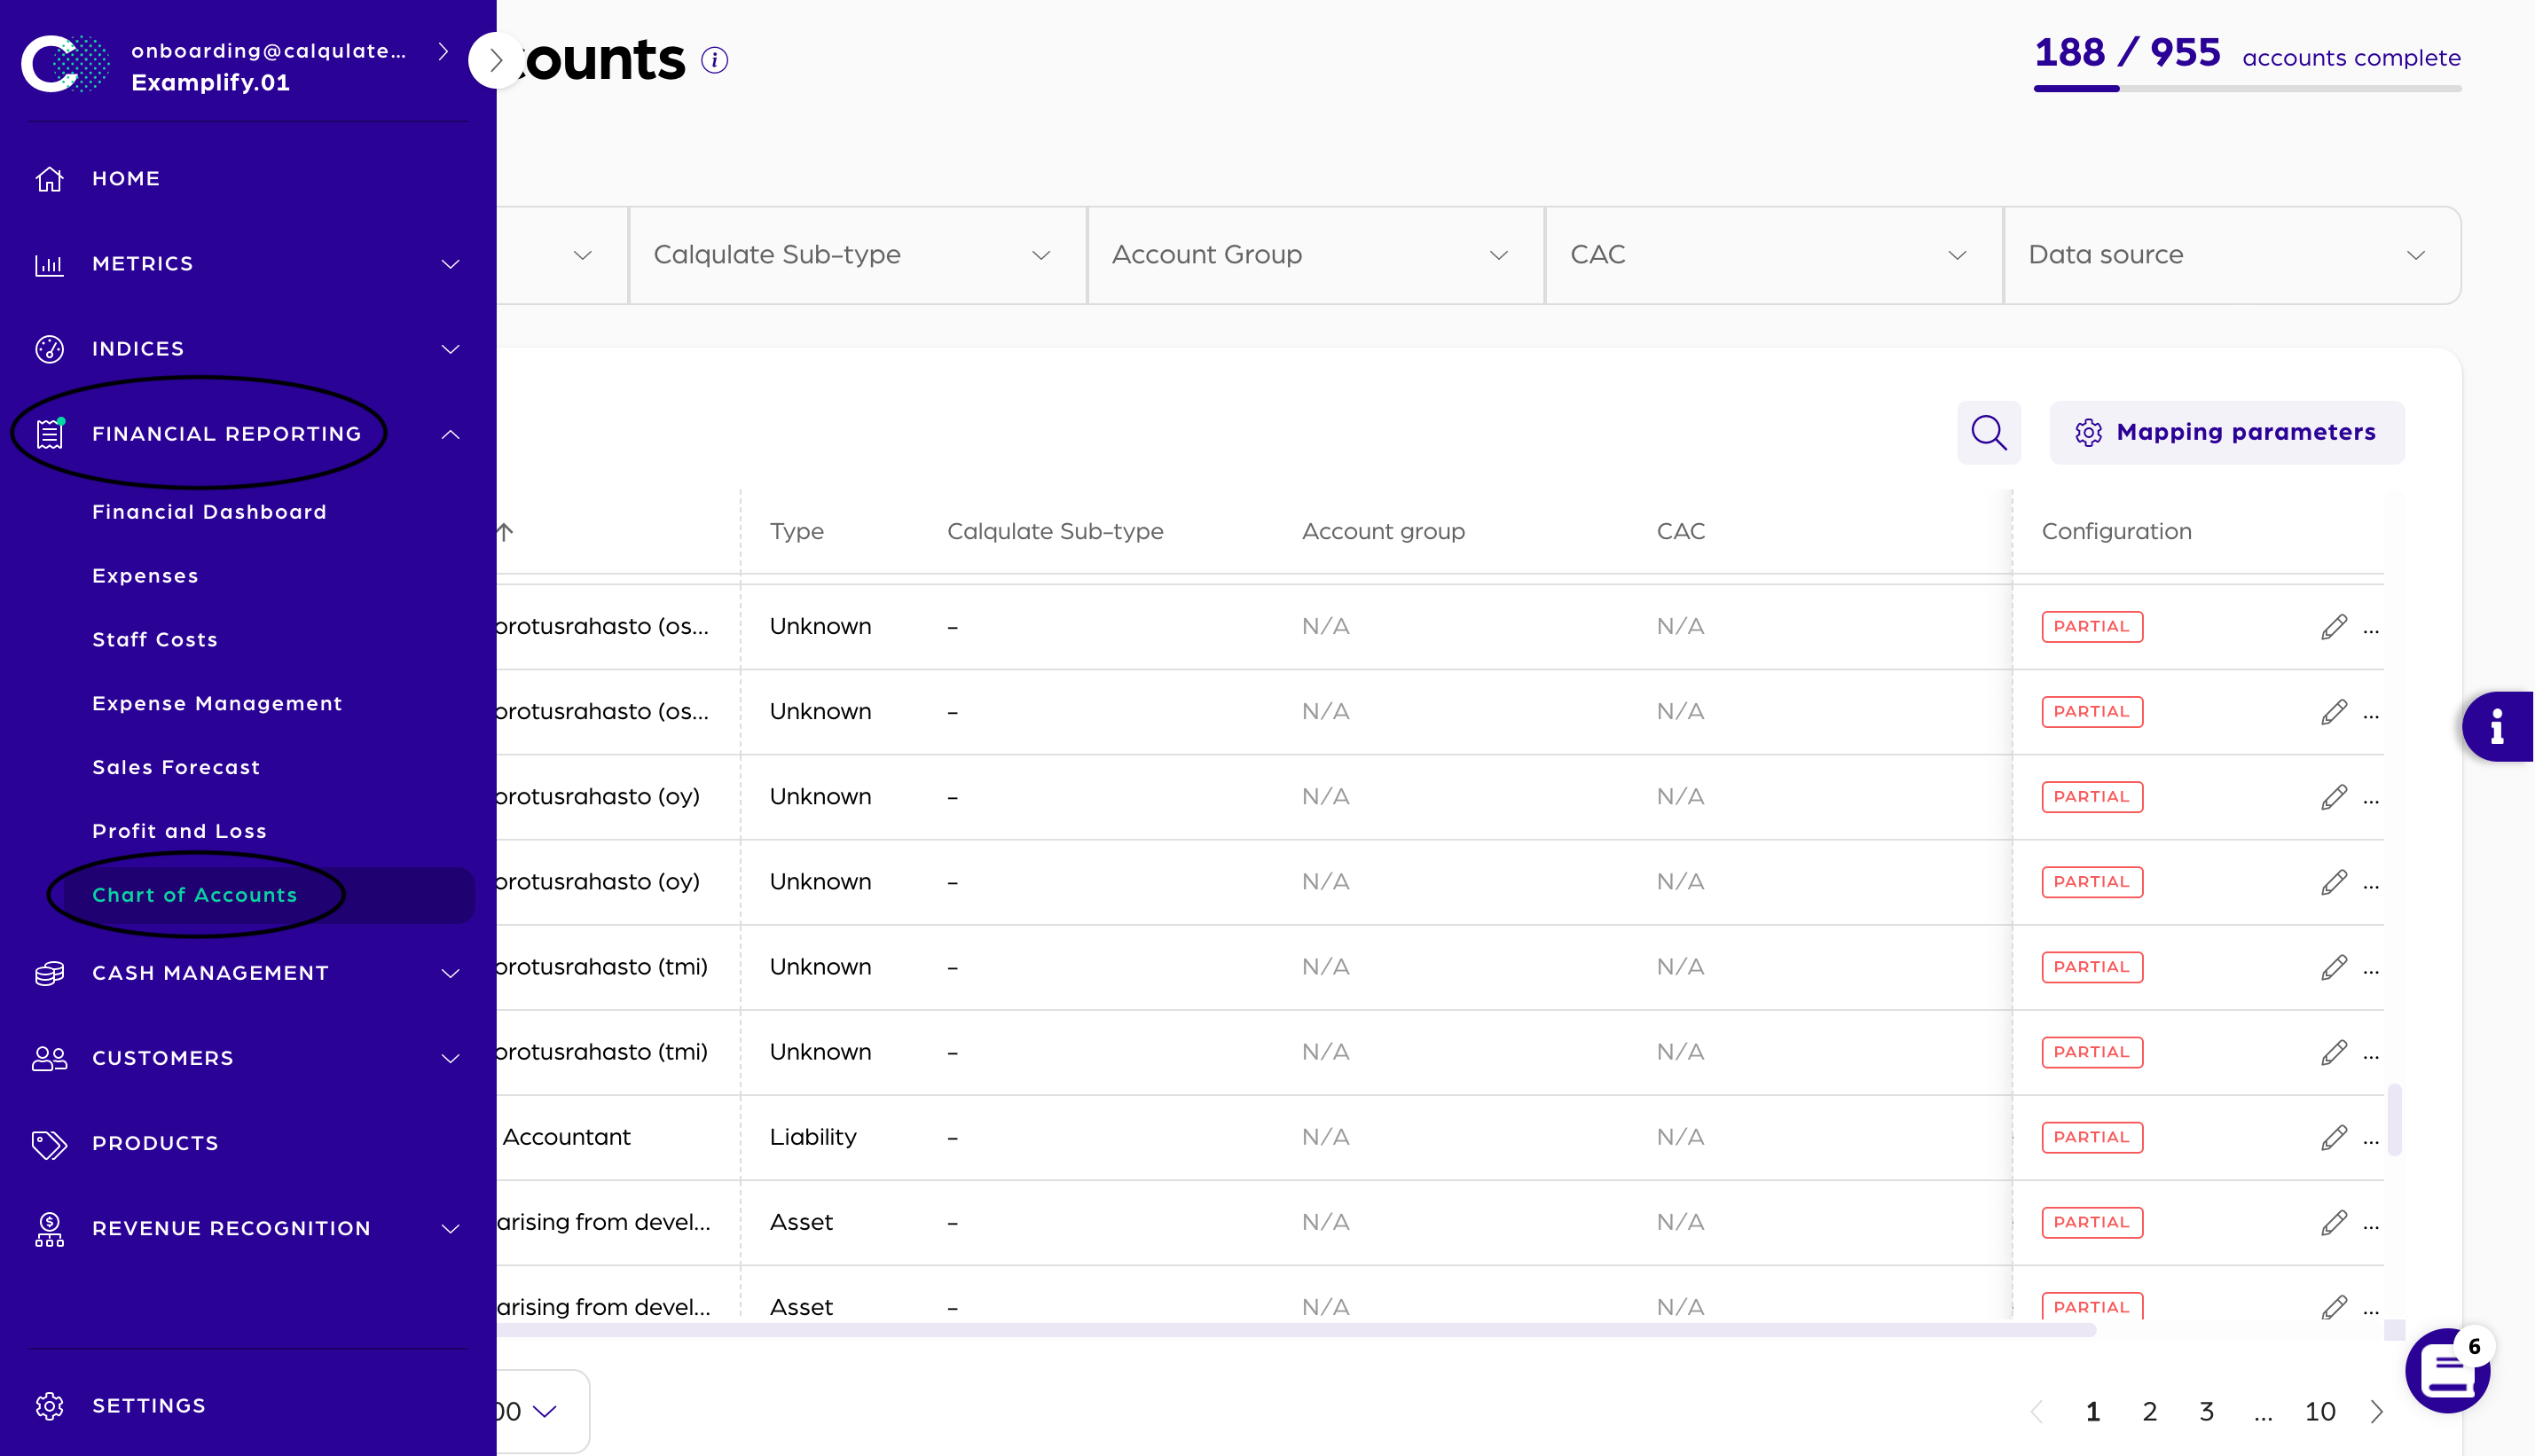
After connecting your accounting software, go to the left-hand menu and click FINANCIAL REPORTING > Chart of Accounts. You can now see a list of all your Accounts. To make this process easier and faster for you, Calqulate's default values map most elements in your Chart of Accounts so that the Profit & Loss reporting is automatically correct.
The Chart of Accounts is the foundation of many elements in Calqulate's financial analytics. It drives:
- Profit and Loss reporting
- Type and Sub-type in the Chart of Accounts are the driver for Profit & Loss Reporting
- Expense analytics
- Account Group in the Chart of Accounts in the driver for Expense analytics
- Customer Acquisition Costs in the Unit Economics dashboard
- CAC in the Chart of Accounts is the driver for customer acquisition cost analytics
- Cashflow forecasting based on cash links
- Cash links in the Chart of Accounts are the driver for cashflow forecasting
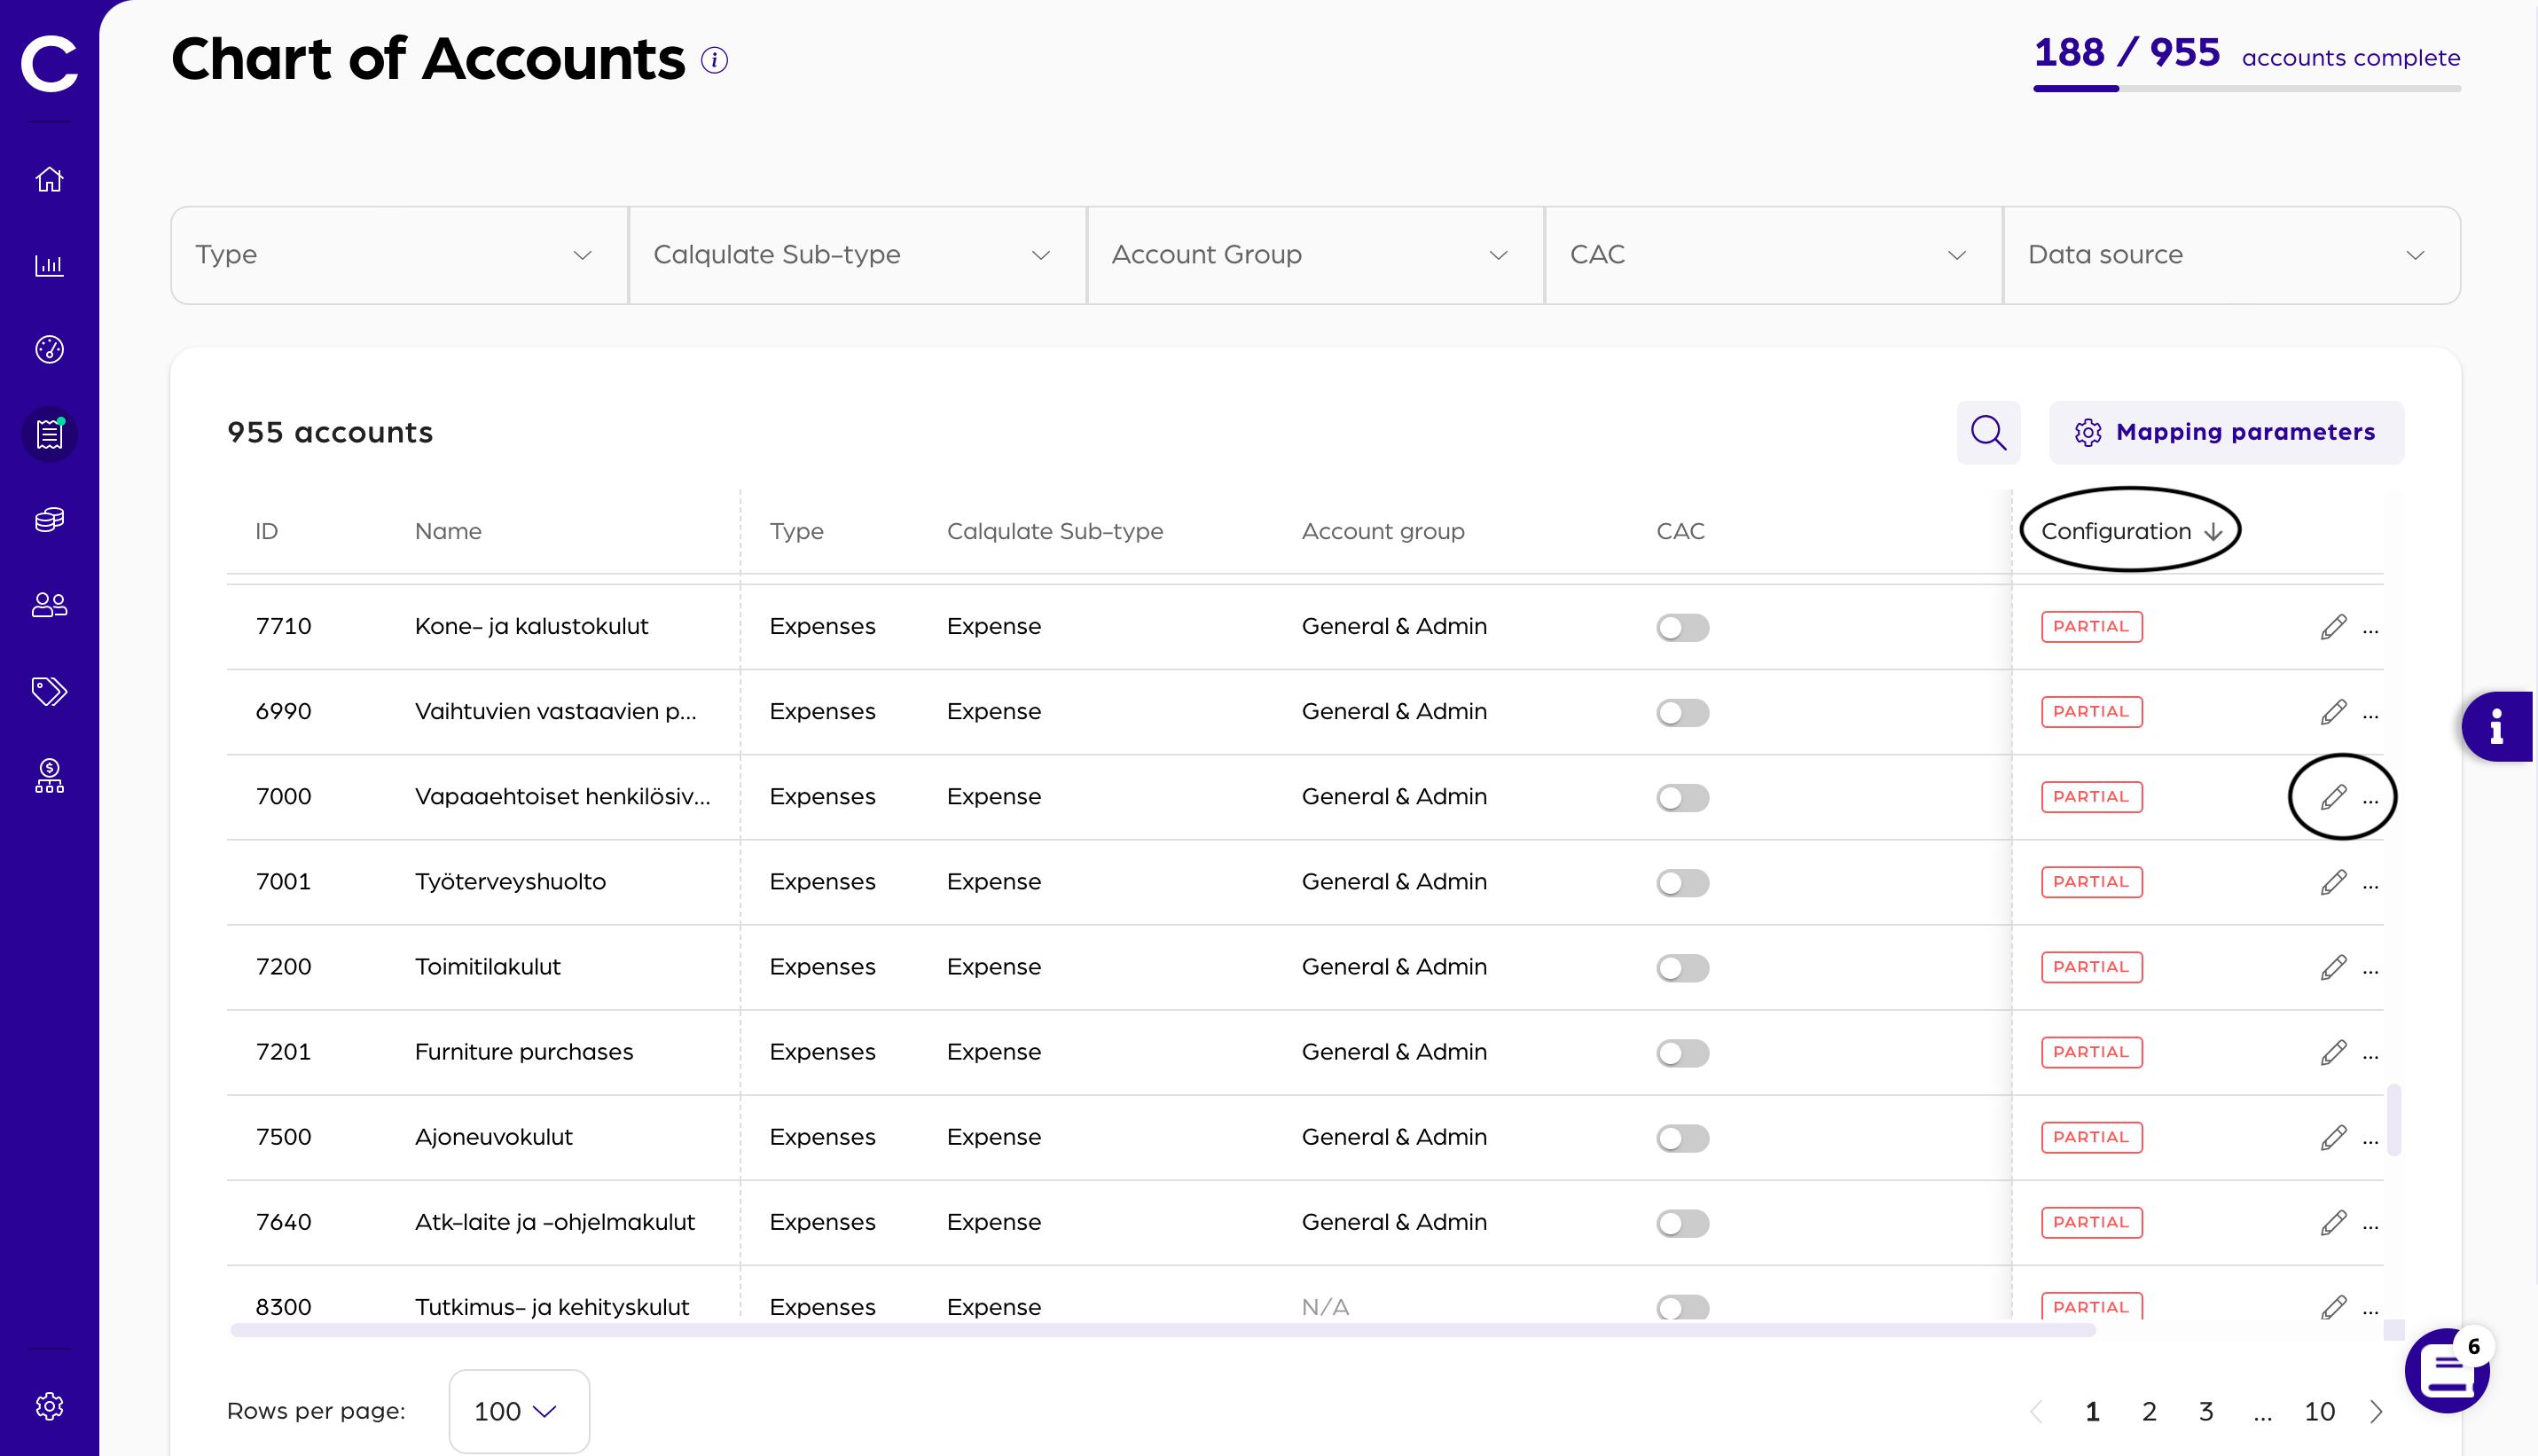
In the top right of the page, you can see the total number of accounts that are mapped completely out of the total number of your accounts.
Click on the header of the Configuration column to bring all Accounts to the top that are Partial mapped.
There are two possible configurations:
- Partial: Meaning the account is only partially mapped and information about the Sub-type, the Cash Links or the Account Group is missing
- Complete: The account will be shown as mapped completely when it has at least Type, Sub-type and Account group added, and therefore it has enough data to appear in the P&L as well as the Expense analytics
To finish mapping an account or edit it, click on the pencil icon on the right side of your screen.
Within the new pop-up window you can edit the information about the account. The Type and the Calqulate Sub-type are inherited from your Accounting software.
You can now assign the account to an Account group, which provides an additional level of detail in your financial reporting. More information about this can be found in the article about the Chart of Account Mapping Parameters.
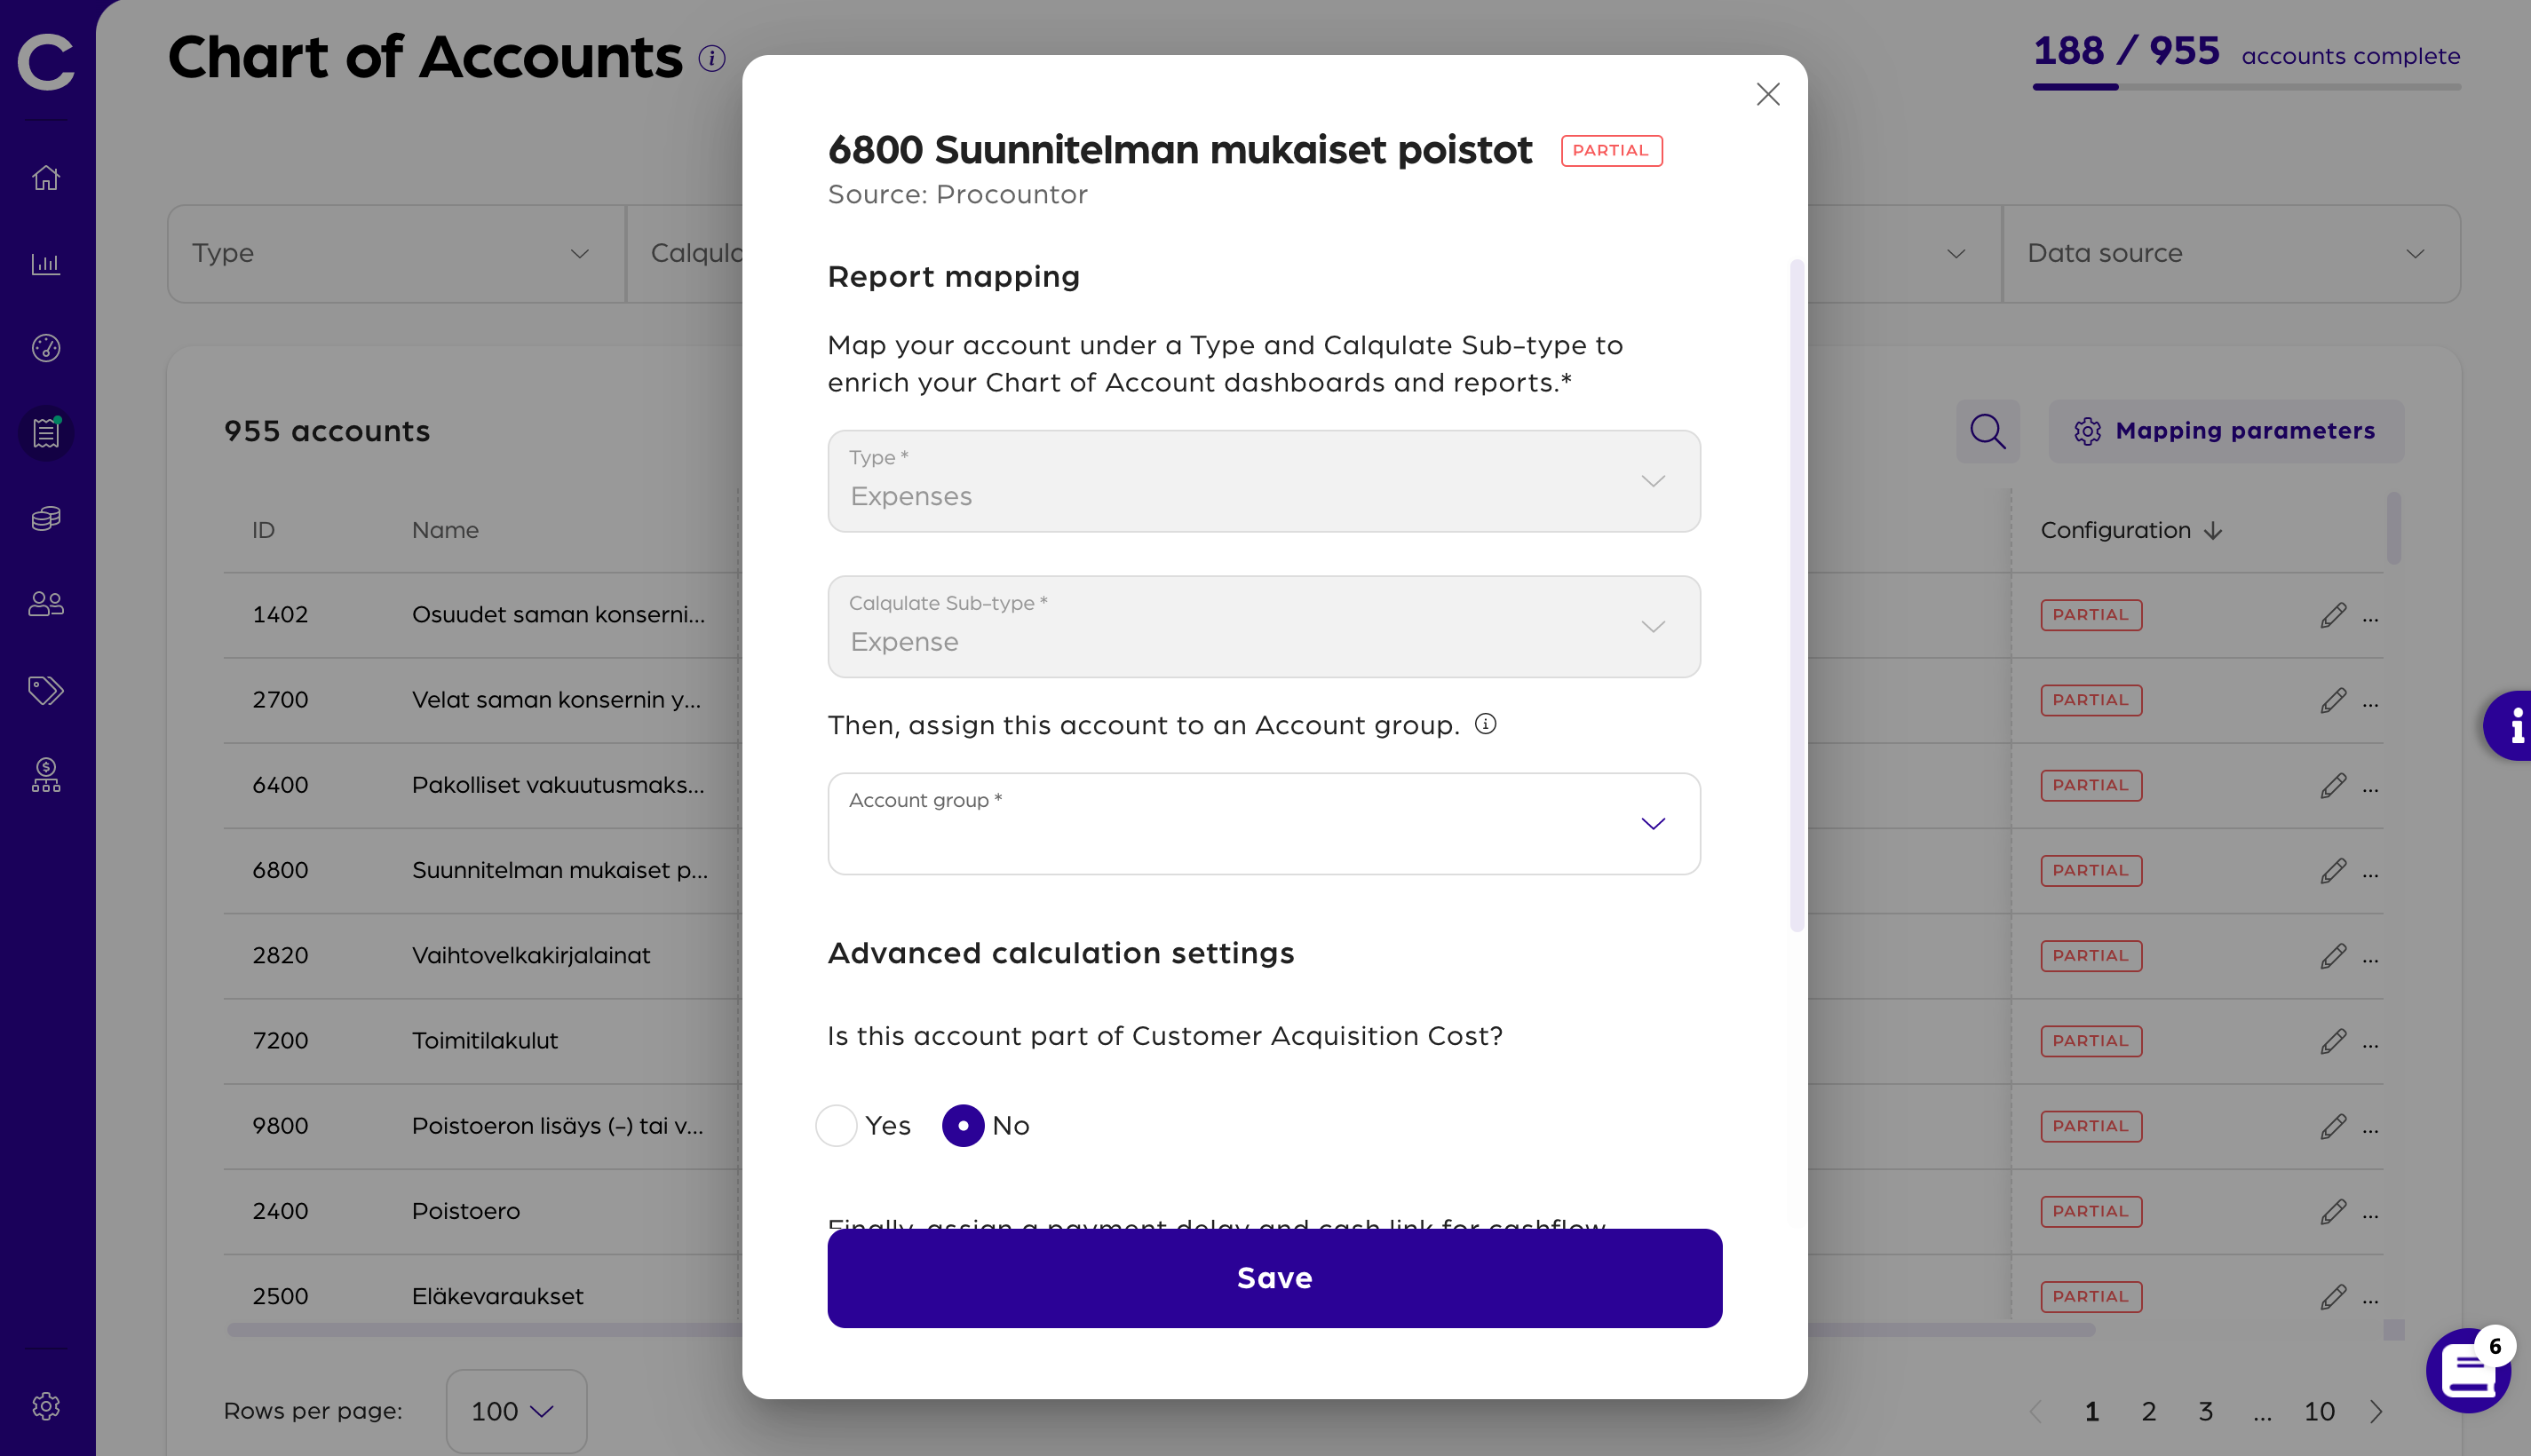
If you scroll down you can also decide if this account contributes to your Customer Acquisition Costs. Typically all salaries and expenses from your Sales and Marketing departments should count towards your CAC calculation. If you are not sure, wether an expense should be included or not, check out this article for more detail.
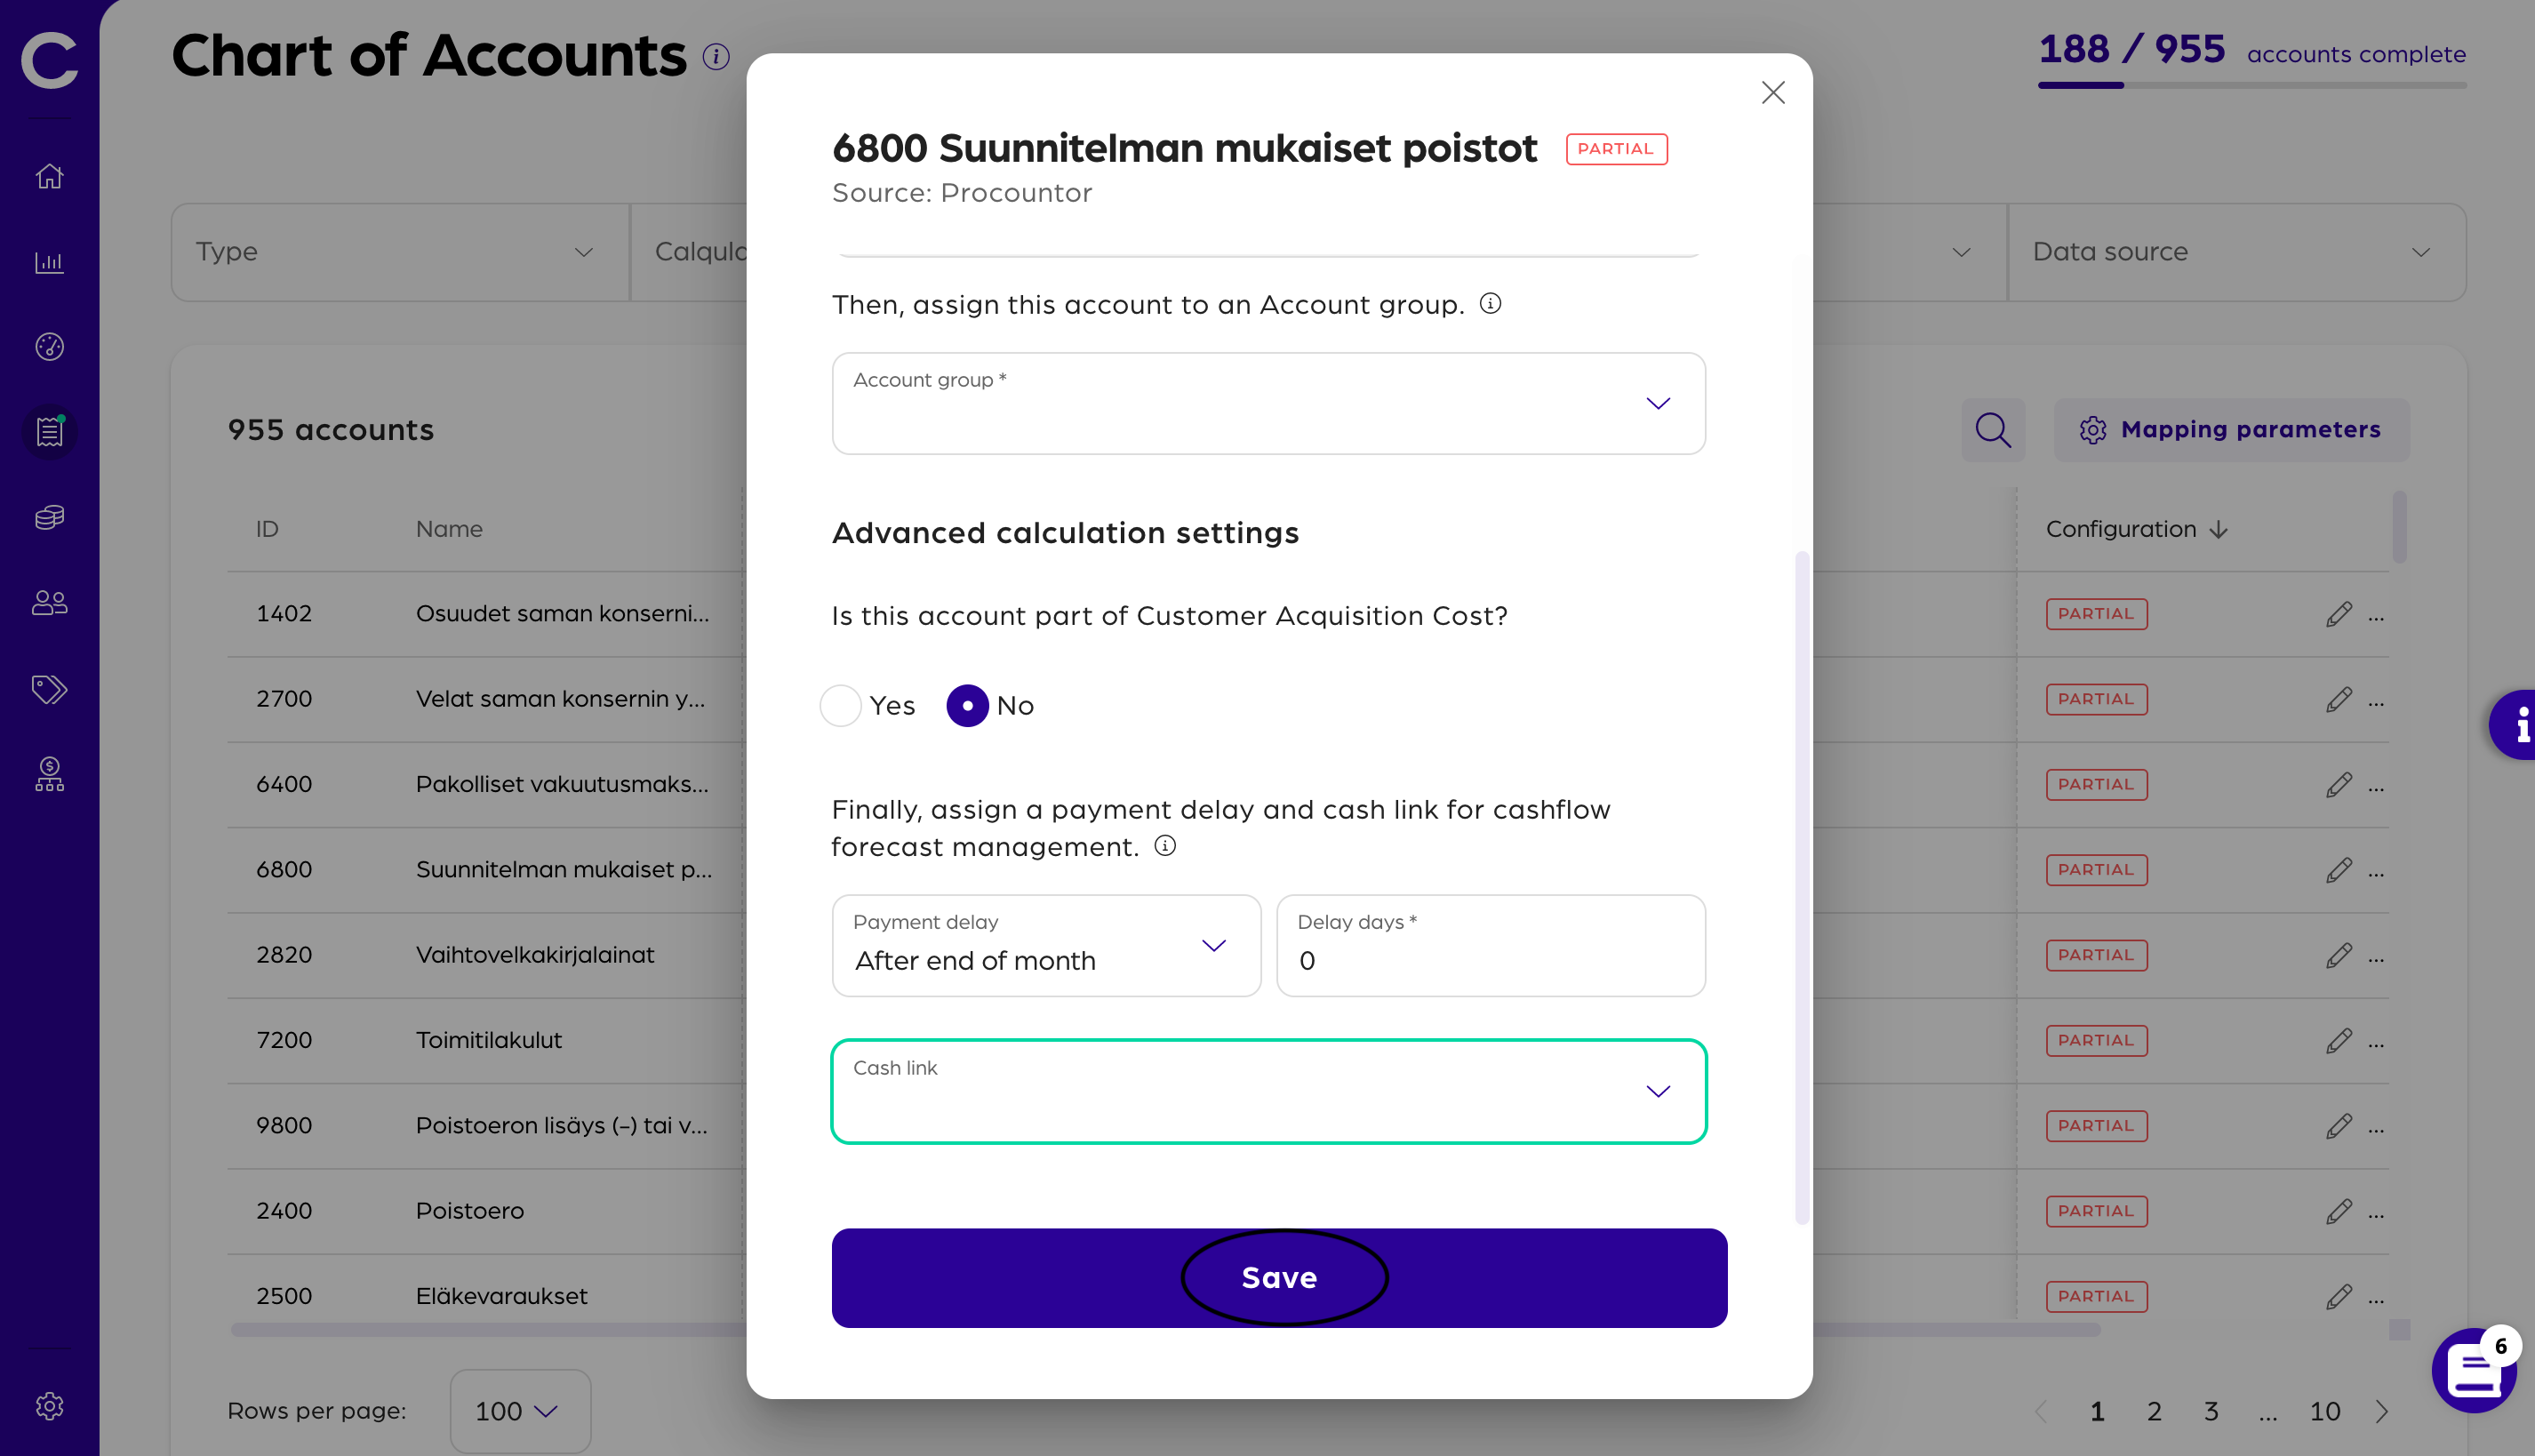
The next field Payment delay allows you to set a custom payment delay for that account. For example, most EU tax payments don't have to be paid for a period of 15 days after the salary was transferred. If you want to learn more about the payment delay, check our article about it.
After this, you have to set up the Cash link so your Cashflow forecast is correct. Therefore, select whether the account is Cash in or Cash out and choose the row for it to appear in your Cash Management. If you want to know more about Cash links, read this article.
When you are finished continue by pressing Save at the bottom of the window.
That's it, you have now completely mapped your first account. With this step, you have just eliminated the majority of the manual work associated with creating departmental cost analysis. At the same time, you have just greatly improved the measurement of your Customer Acquisition costs.
If you want to know how to manage Sub-types and Account Groups, check our article about the Mapping Parameters.
Both of these together will allow you to create more accurate cash flow forecasts and give you a true picture of the costs of a customer.
Where does all of this go?
After you have mapped your Chart of Accounts, Calqulate can create metrics and high-value financial data which you can find in several places:
- Cashflow forecasting
- Expense Management Dashboard
- Profit and Loss Dashboard
- Unit Economics Dashboard
- Balance sheet (coming soon)
Updated over 3 years ago