Financial Health Index
Stakeholder Environment
When a bank or a venture debt company lends money to a startup, credit ratings and credit scores are handy tools. However, those are usually only available to larger companies. There is no well-established indicator for small and medium-sized companies representing their financial health.
At Calqulate we offer the Financial Health Index. It measures a company’s financial health, profitability and liquidity, and calculates a value between 0-100%. It is based on different metrics and uses ratios from three different metric groups: Liquidity, Profitability, and Solvency.
The financial Health dashboard
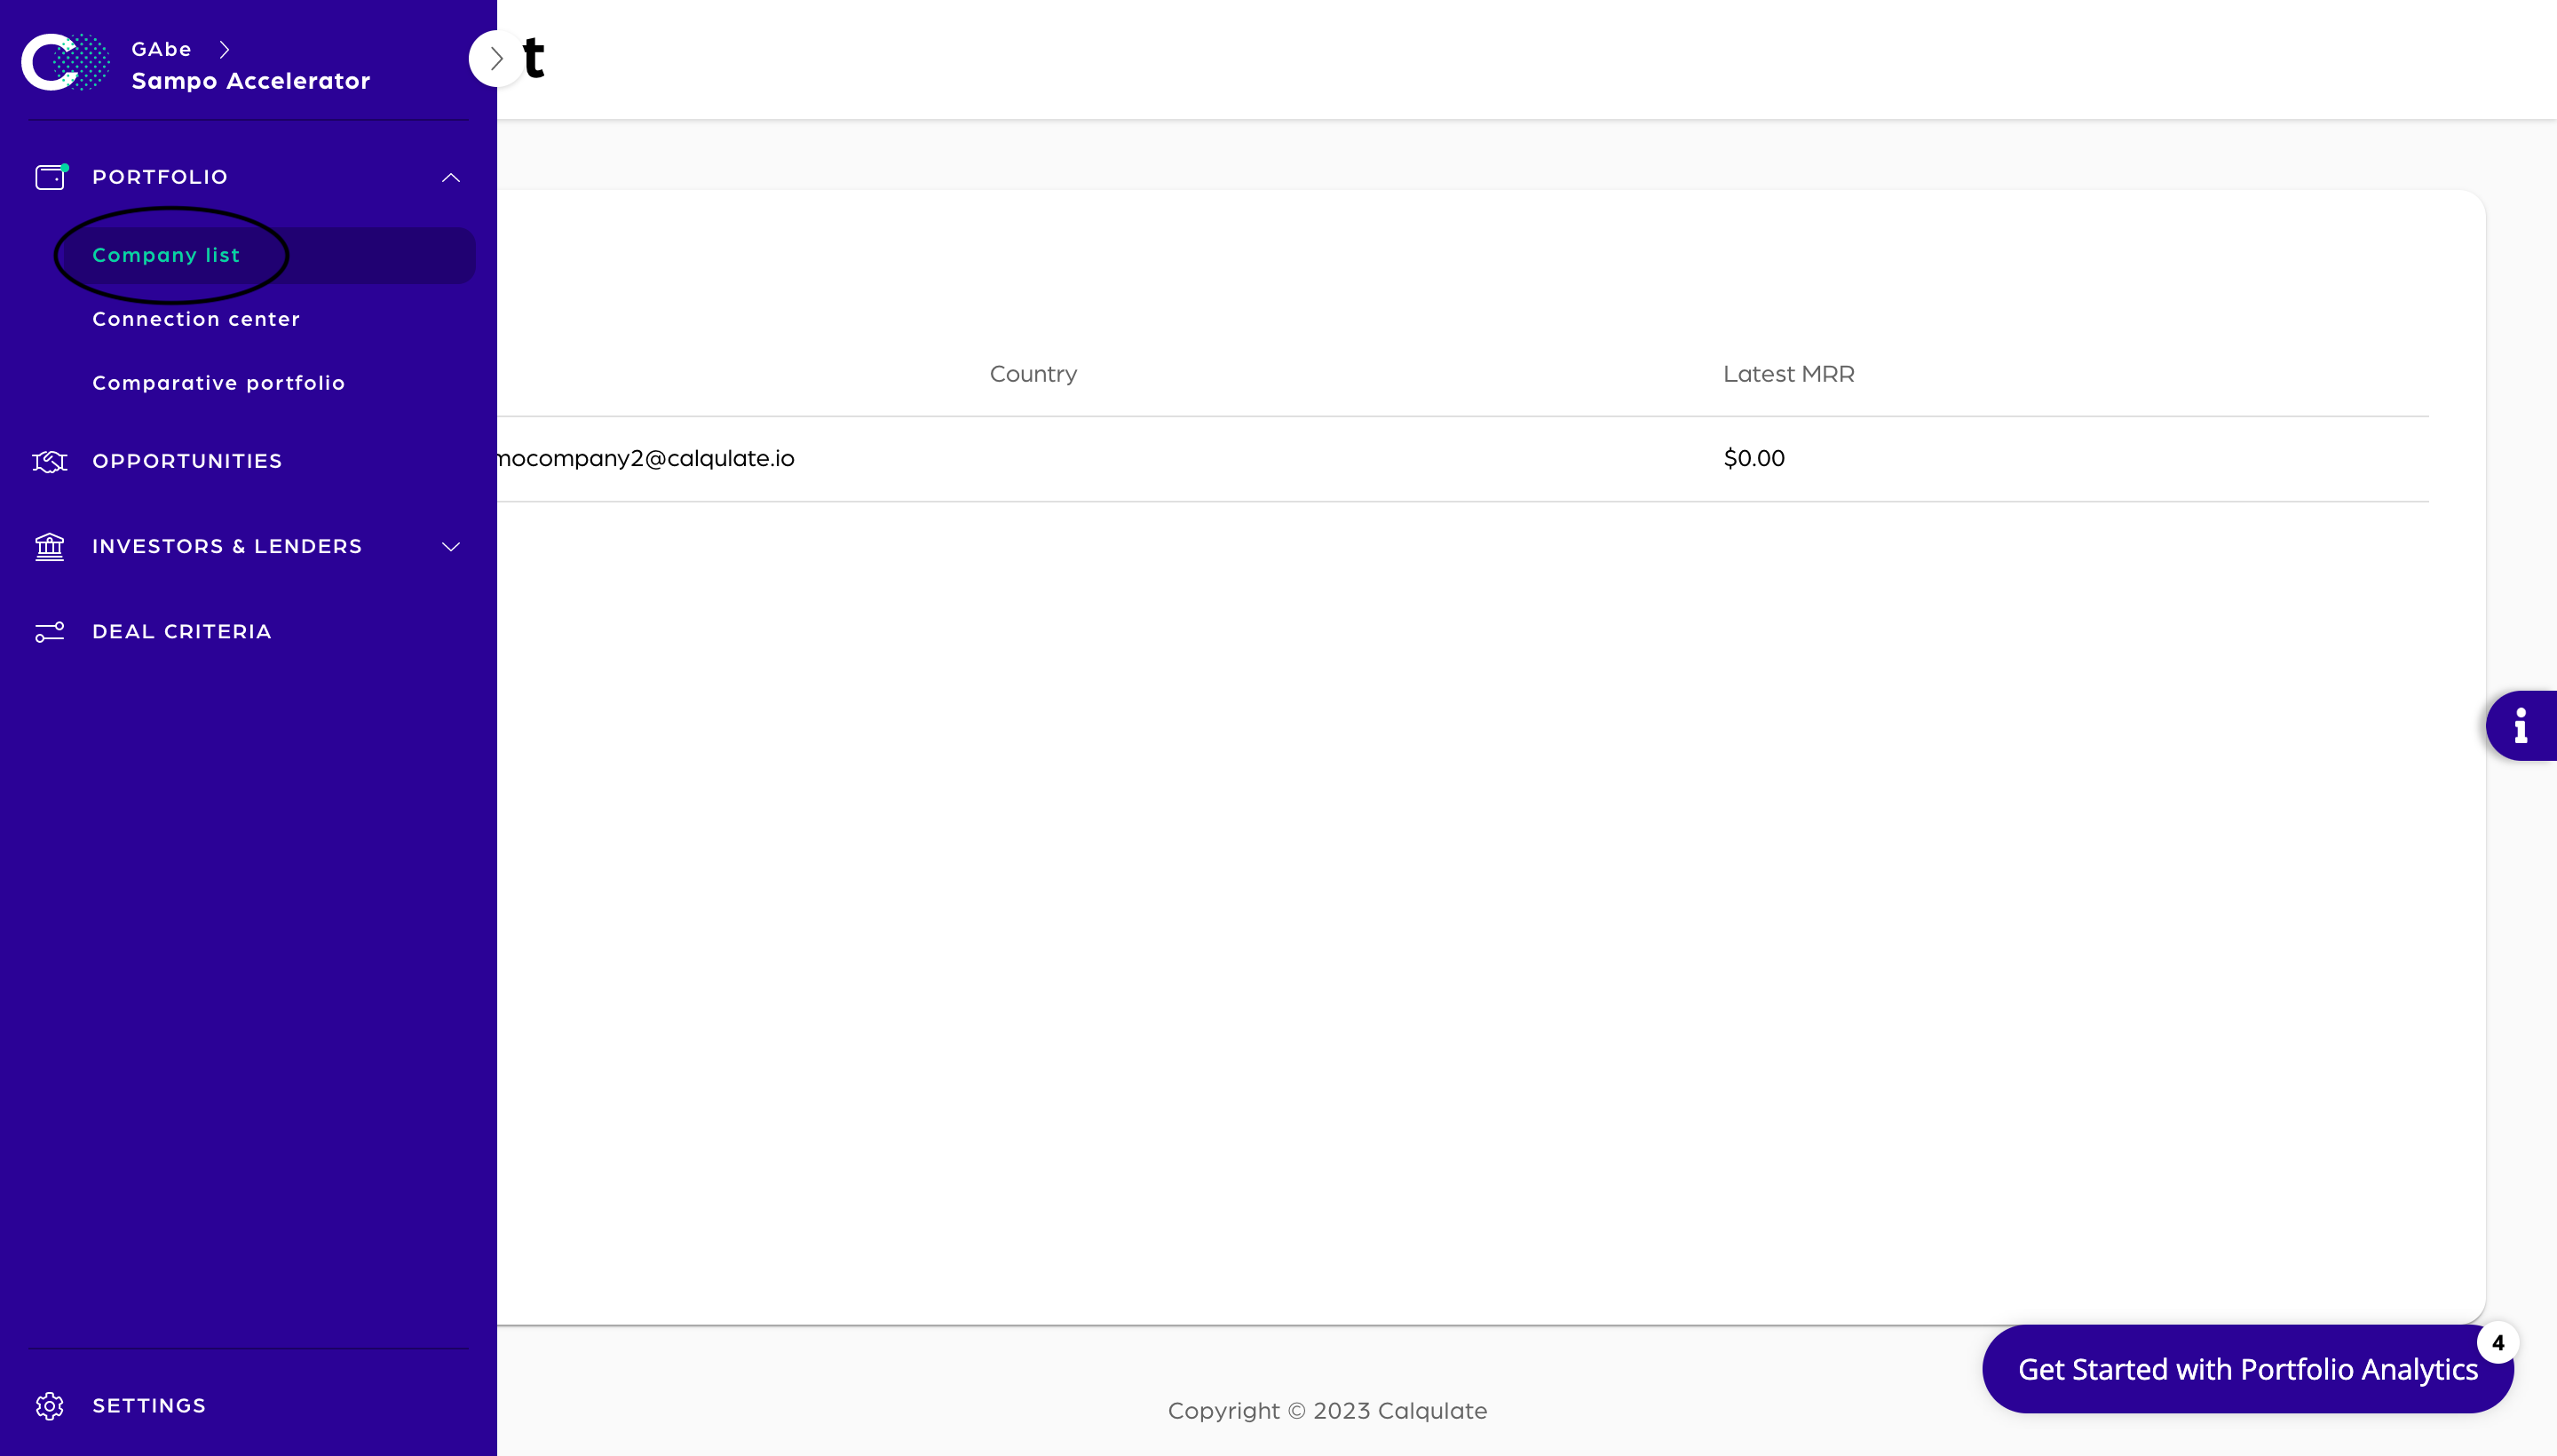
The Financial Health tab can be accessed via PORTFOLIO > Company list in the left-hand menu.
Go to PORTFOLIO > Active Portfolio and choose the company for that you want to check the financial health. Clicking on the company opens a new page that provides more information about this organization.
The company profile includes a variety of information about an organization, distributed into different tabs. By accessing the Financial Health tab, more information about the Financial Health, the Liquidity or Profitability of the organization can be accessed.
Choosing Financial Health in the left hand menu will display the graphs Financial Health Index, the Financial Health Metrics, and the Financial Health Index evolution.
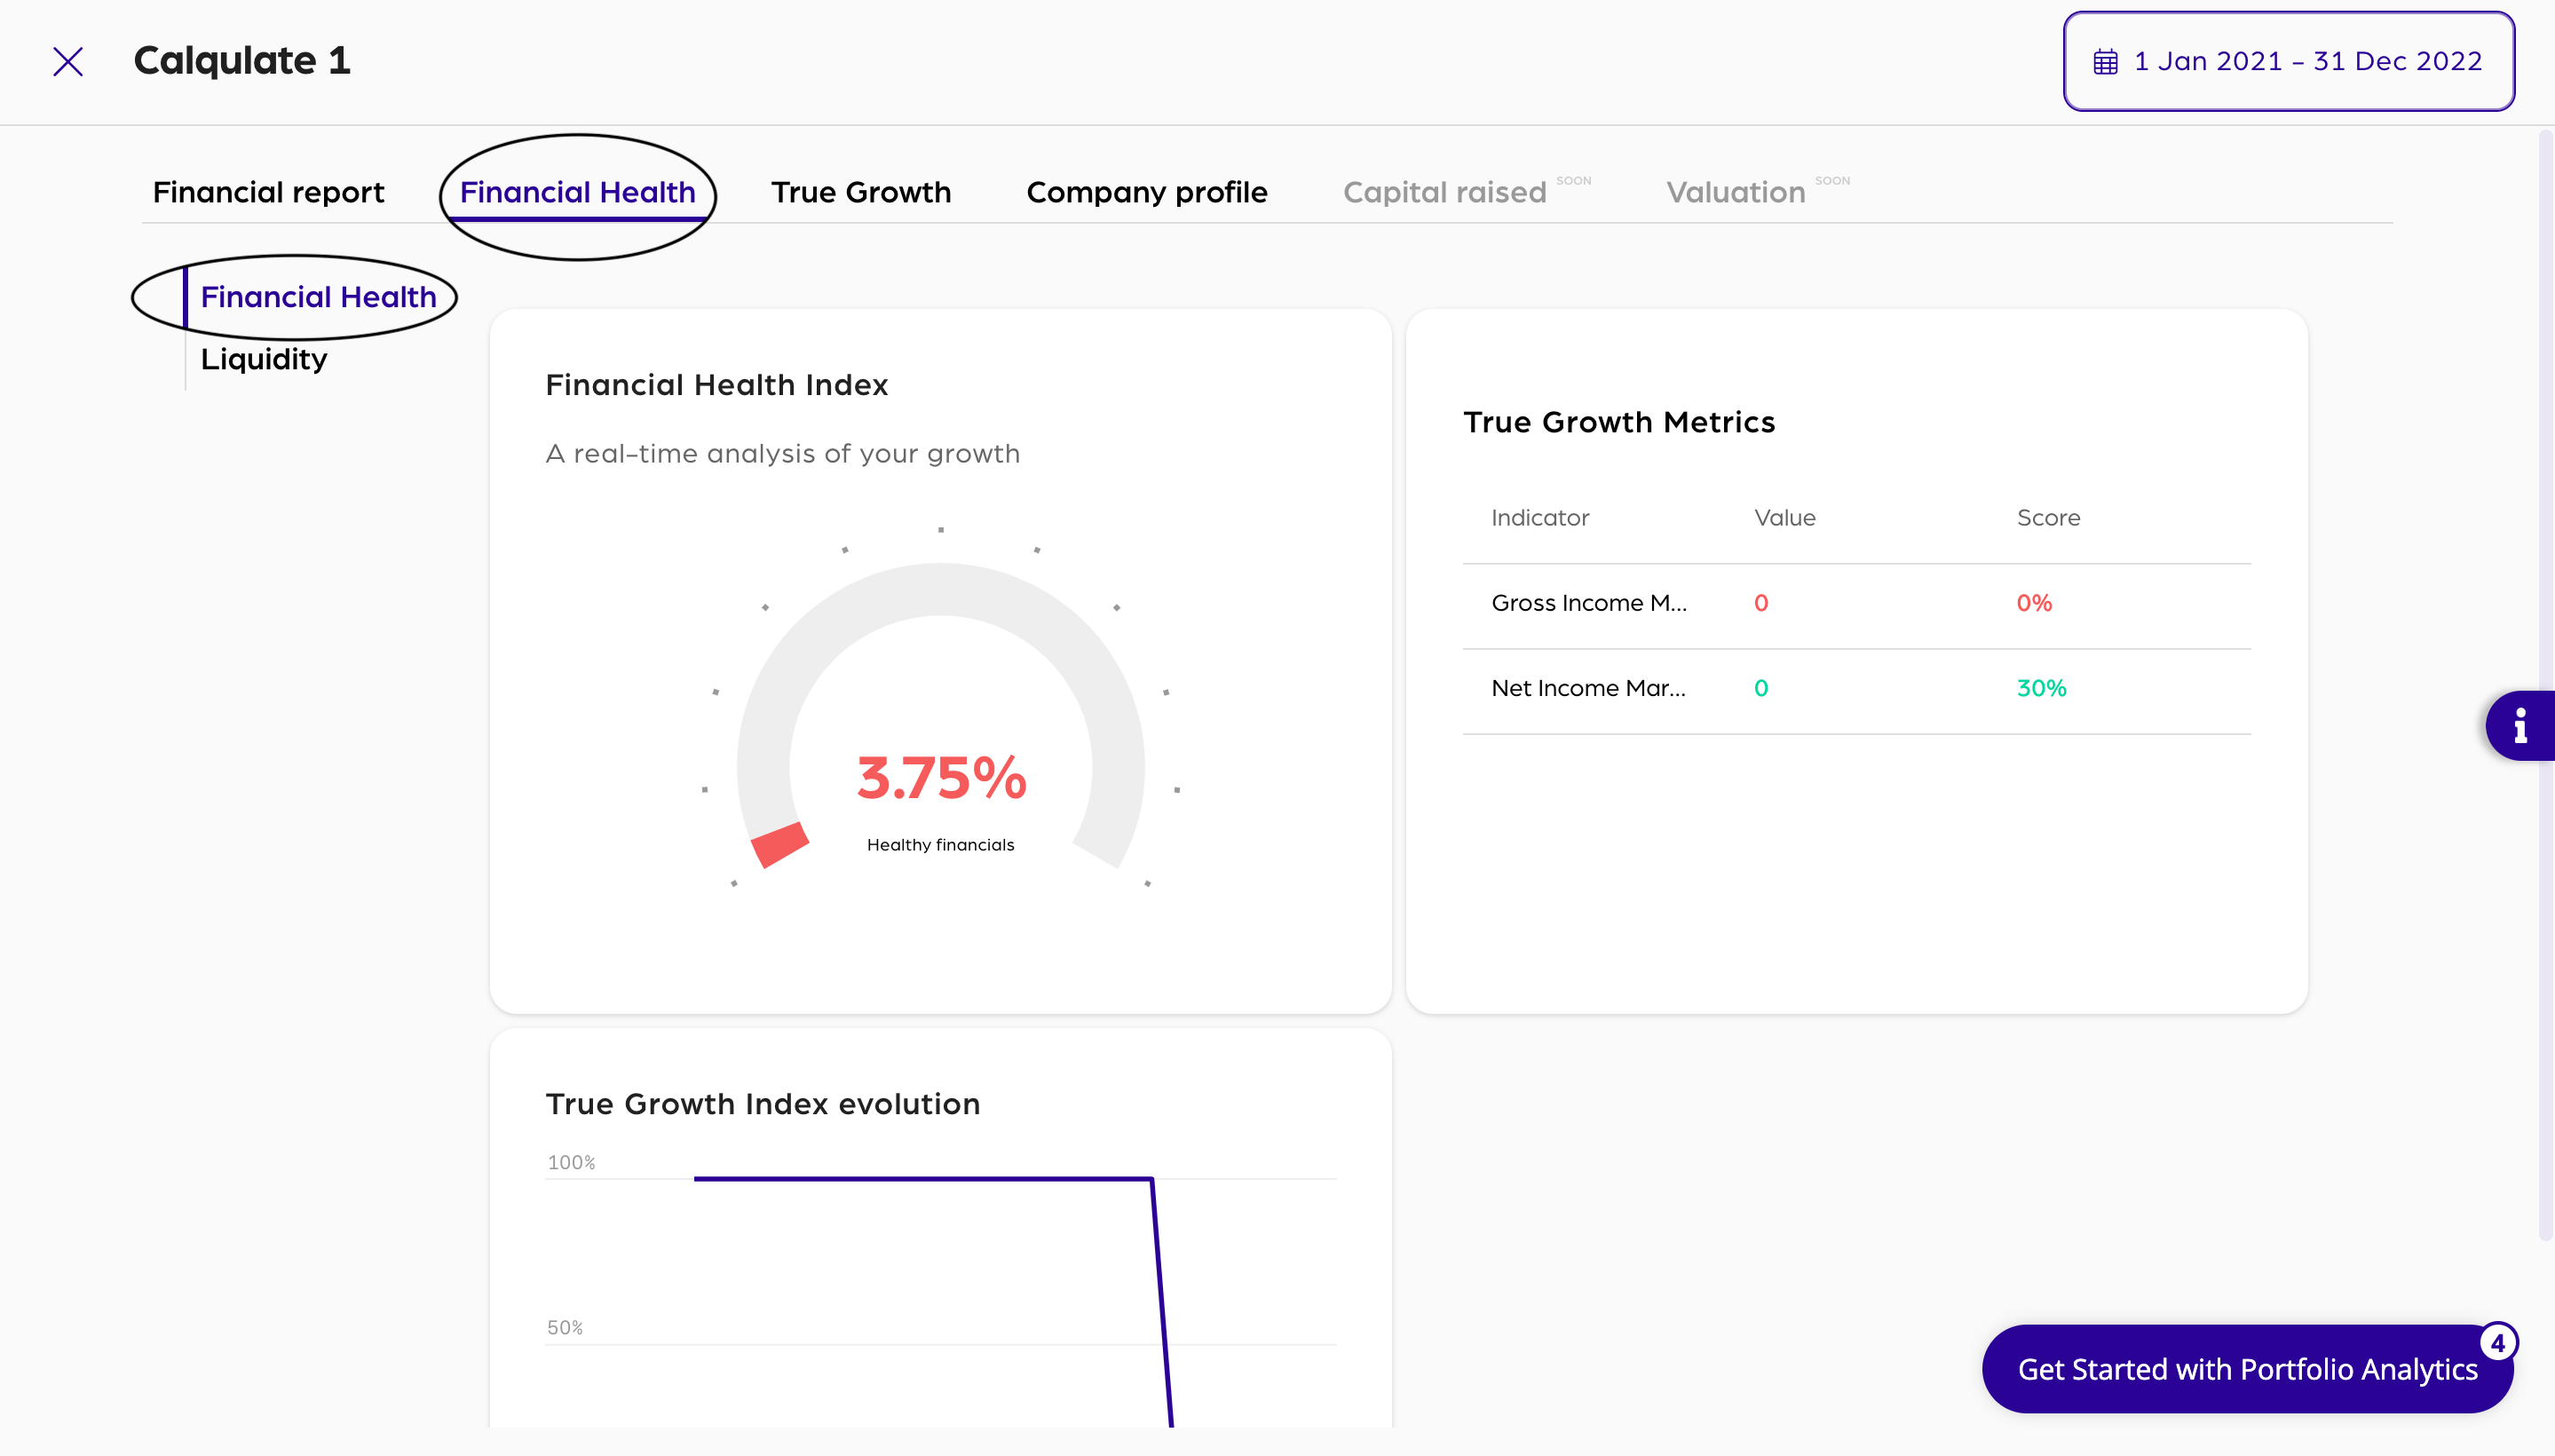
The Financial Health Index displays your overall performance on a speedometer (gauge) chart. Your company scores between 0 and 100 %, whereby 100 % is the best possible result. The Financial Health Metrics, which are displayed on the right side of the screens, lists all metrics that are used to calculate the index value. All metrics are listed with the ratio and the score in percentage so you can understand how the index value is calculated. The chart below it shows the evolution of the Financial Health Index.
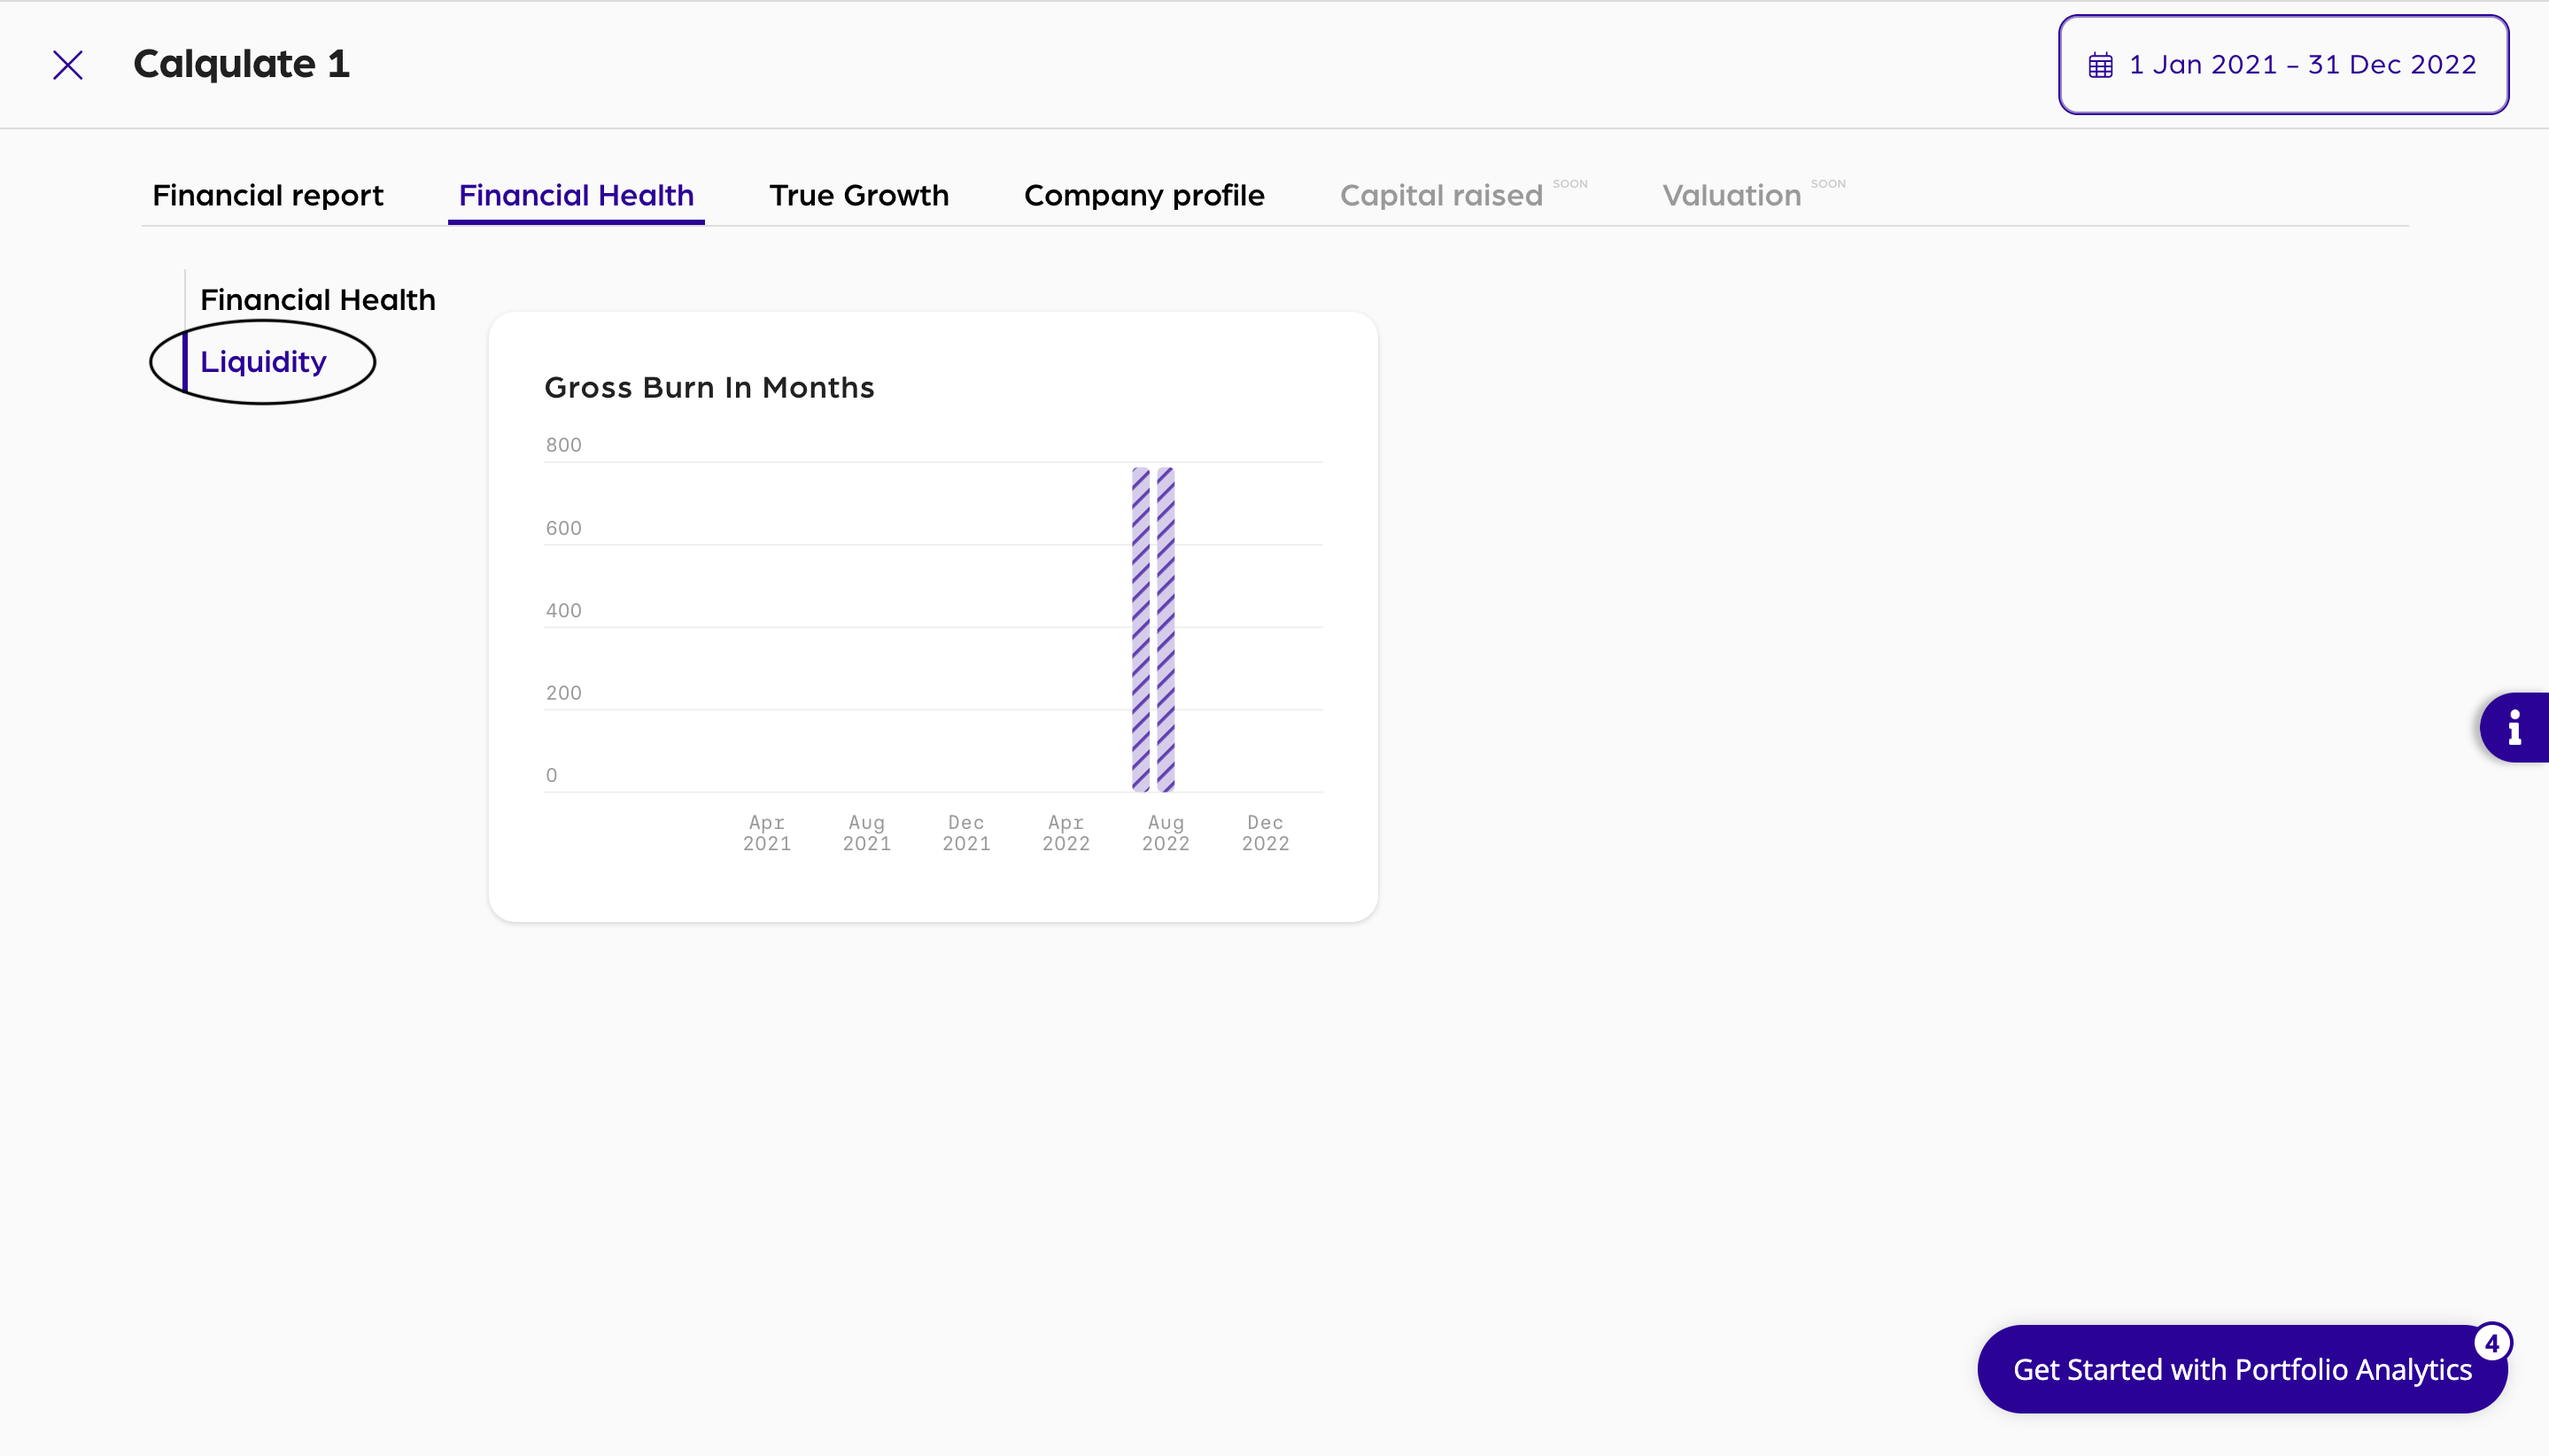
Liquidity
If you click on Lidquidity you can see details about the Gross Burn in Months, which tells you more about a companies lidquidity.
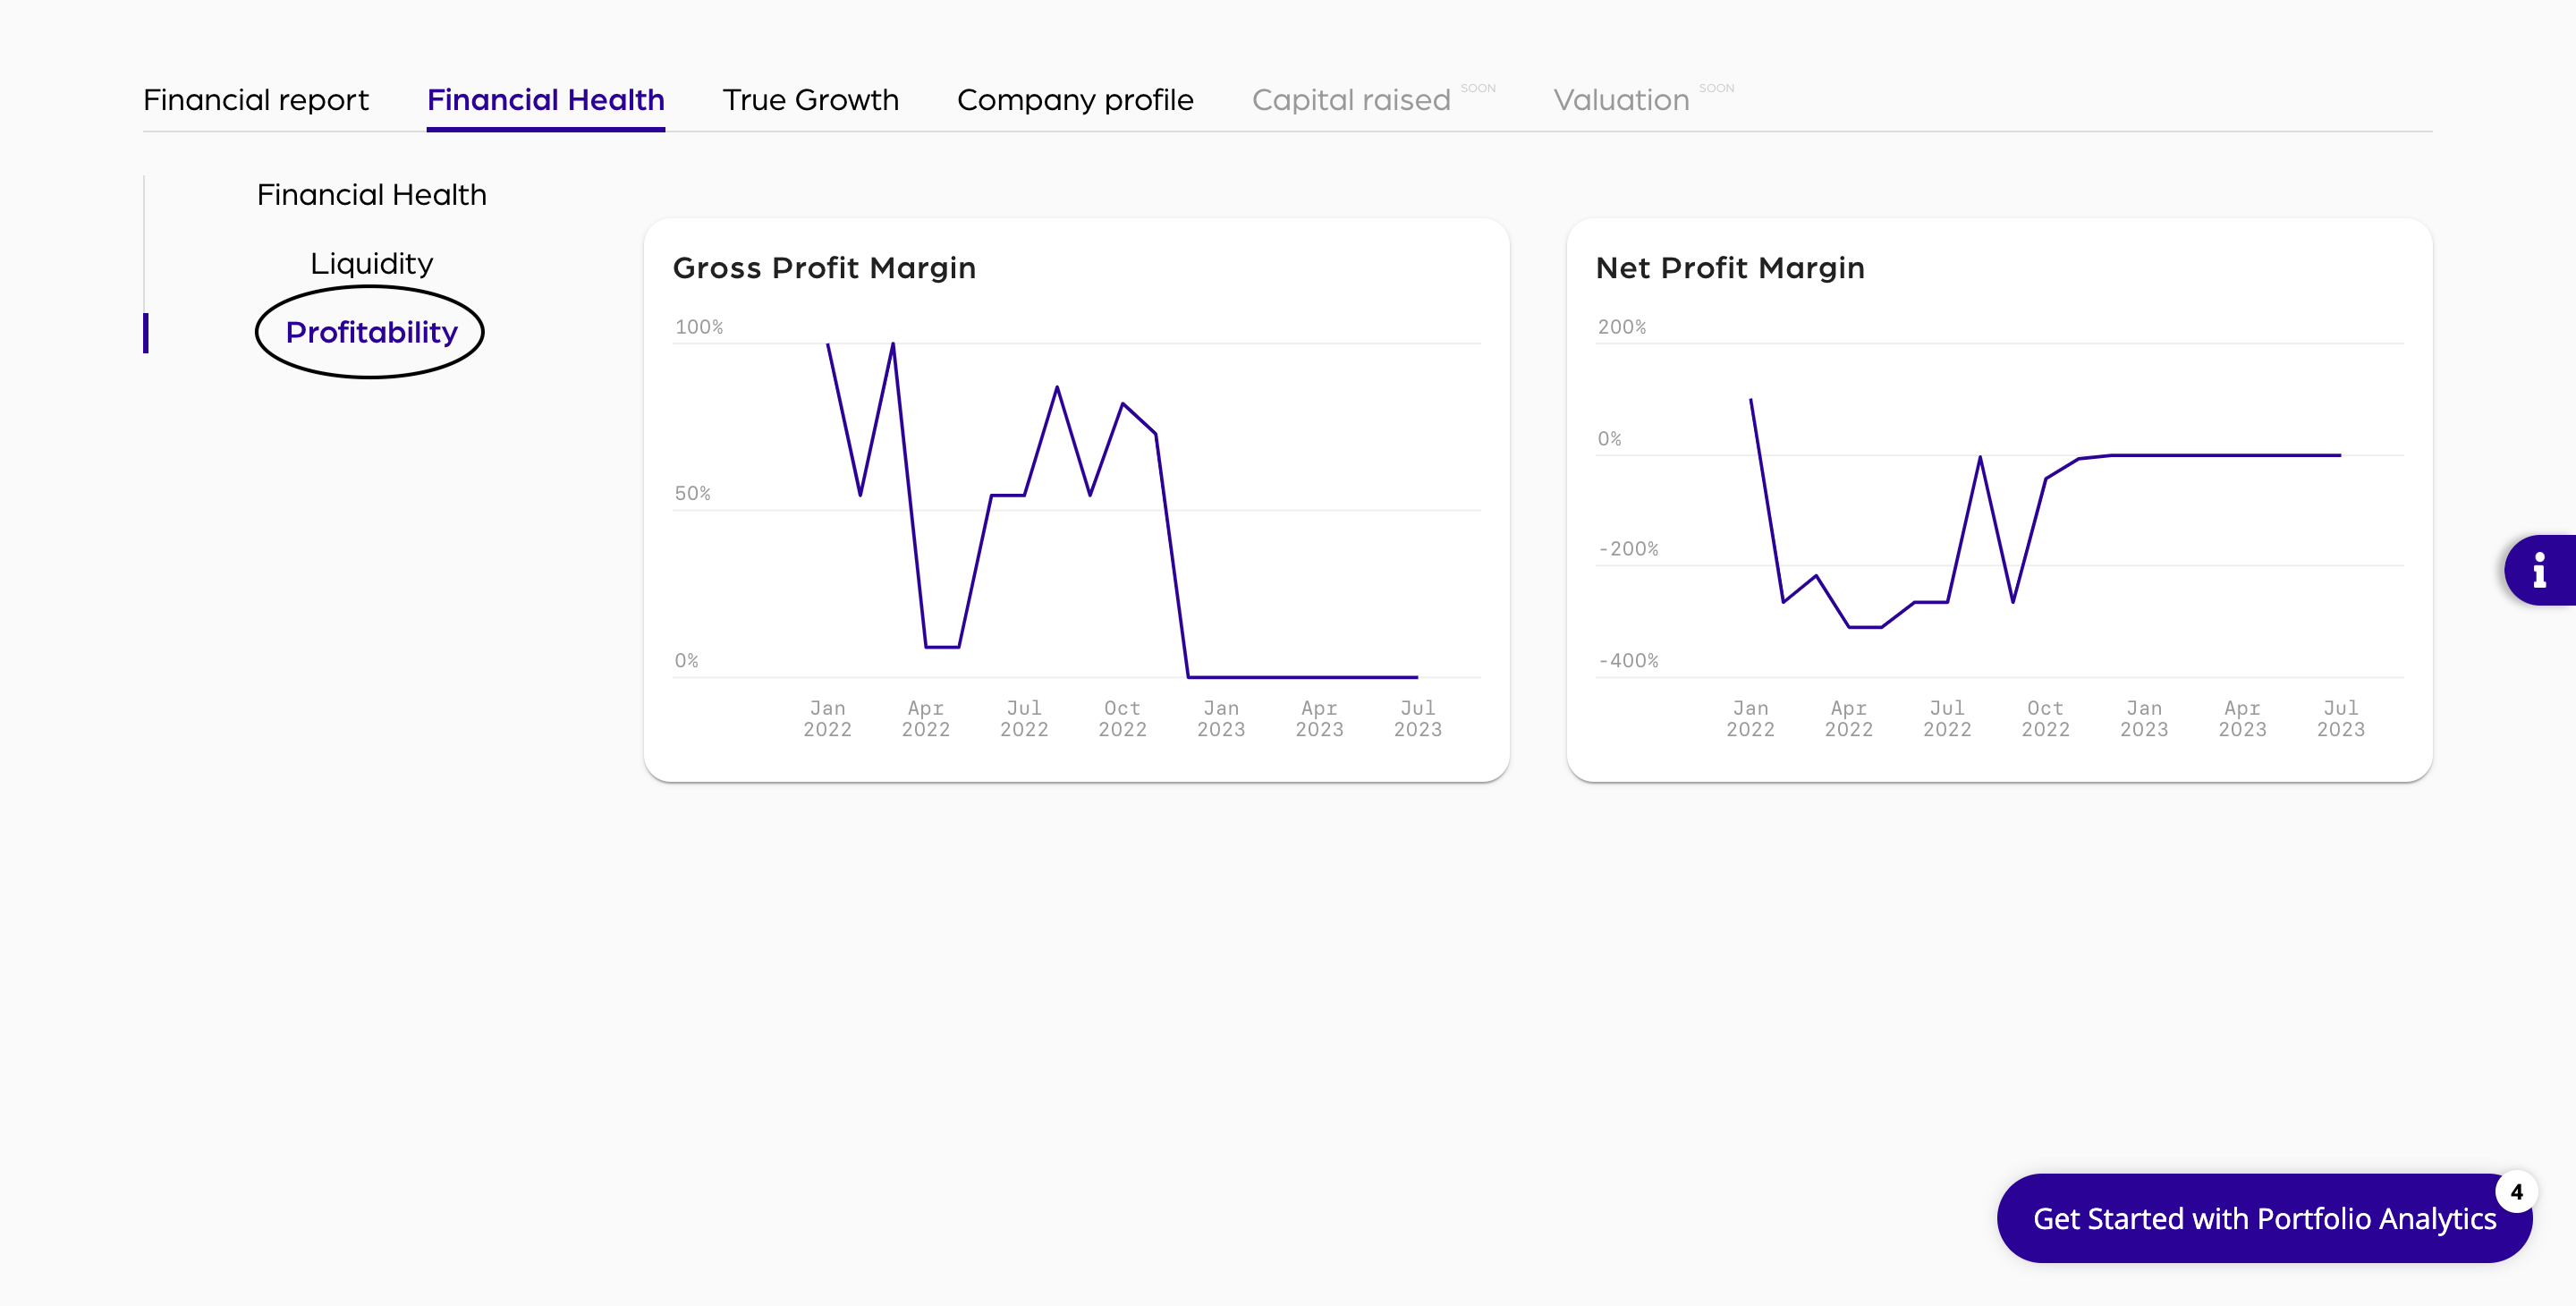
Profitability
The last option in the left-hand menu Profitability displays the graphs Gross Profit Margin and Net Profit Margin.
Updated over 3 years ago