Financial Dashboard
Financial Reporting
Keeping track of your financial data is vital for operating a healthy company. In Calqulate we designed the Financial Dashboard for you to do exactly this, keeping track on your finances. You can find data from three different categories:
- Revenue
- Operating Expenses
- Cost of Sales
To create this data, Calqulate requires you to map your Chart of Accounts and add your Staff Cost, connect your Integrations, and set up your Sales Forecast and your Tracking Categories first.
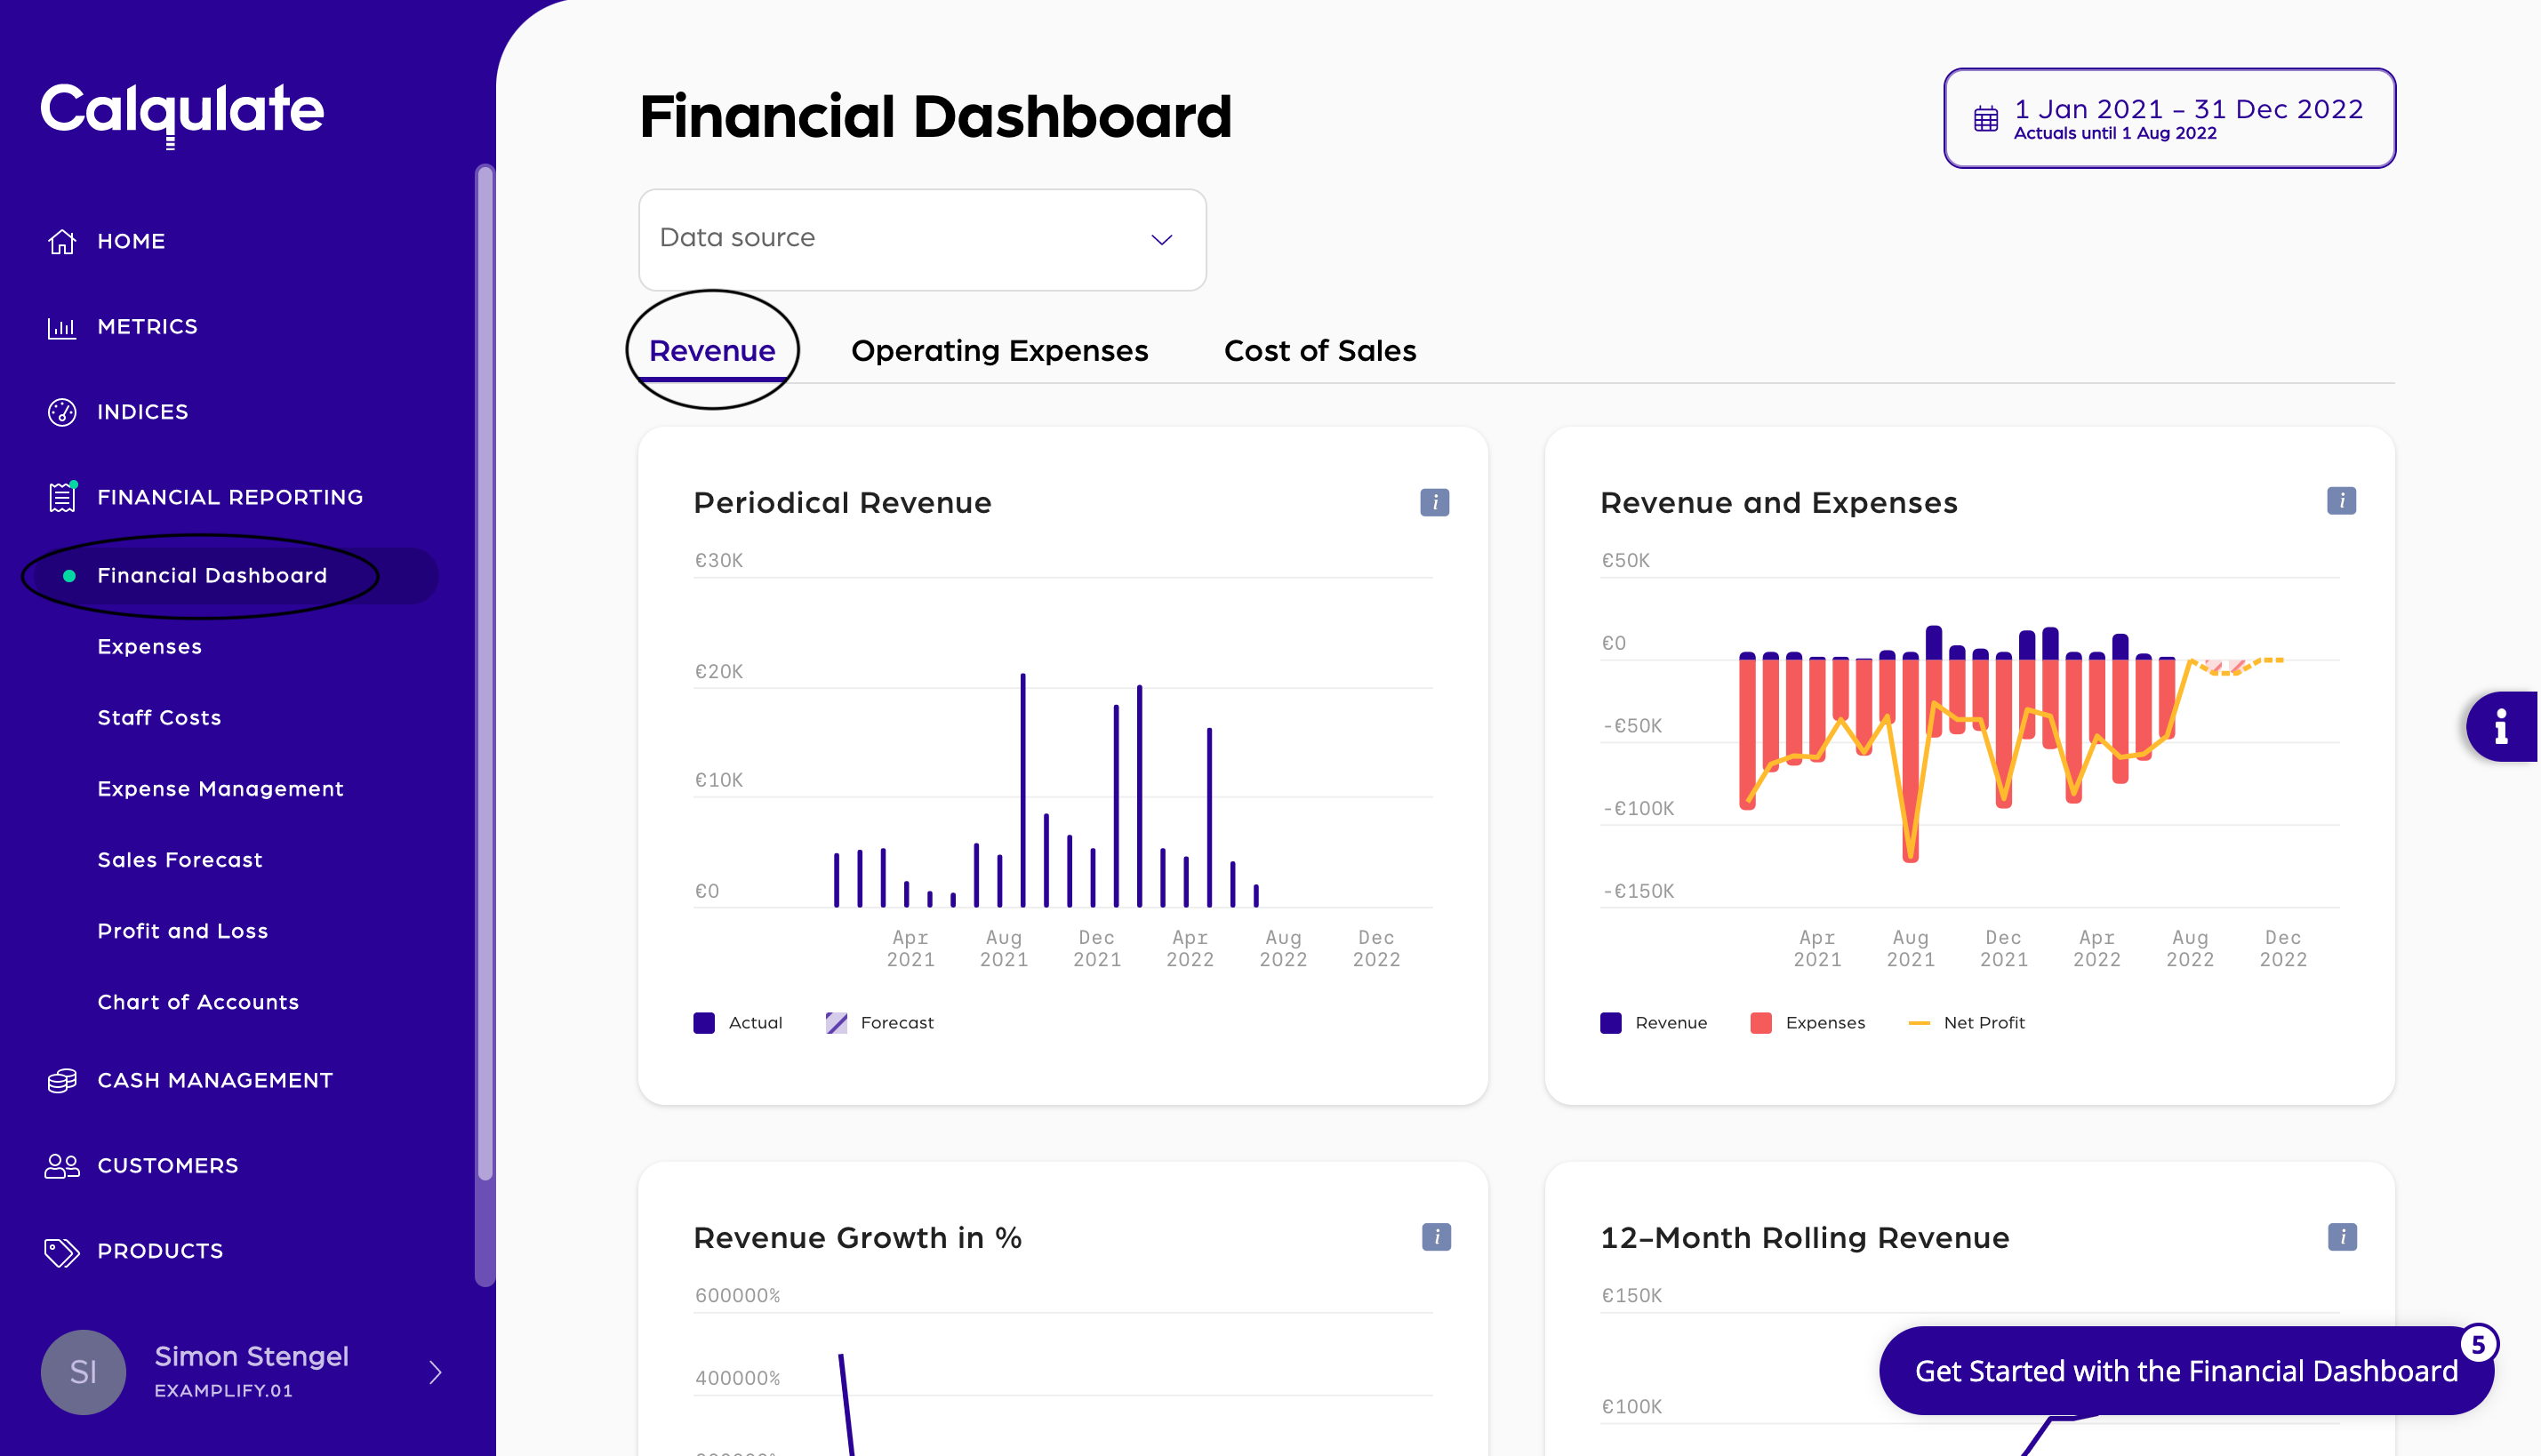
Where to find the Financial Dashboard
Go to your left-hand menu and choose FINANCIAL REPORTING > Financial Dashboard.
The first Tab, Revenue, displays a variety of key metrics about your Revenue and compares it to your expenses.
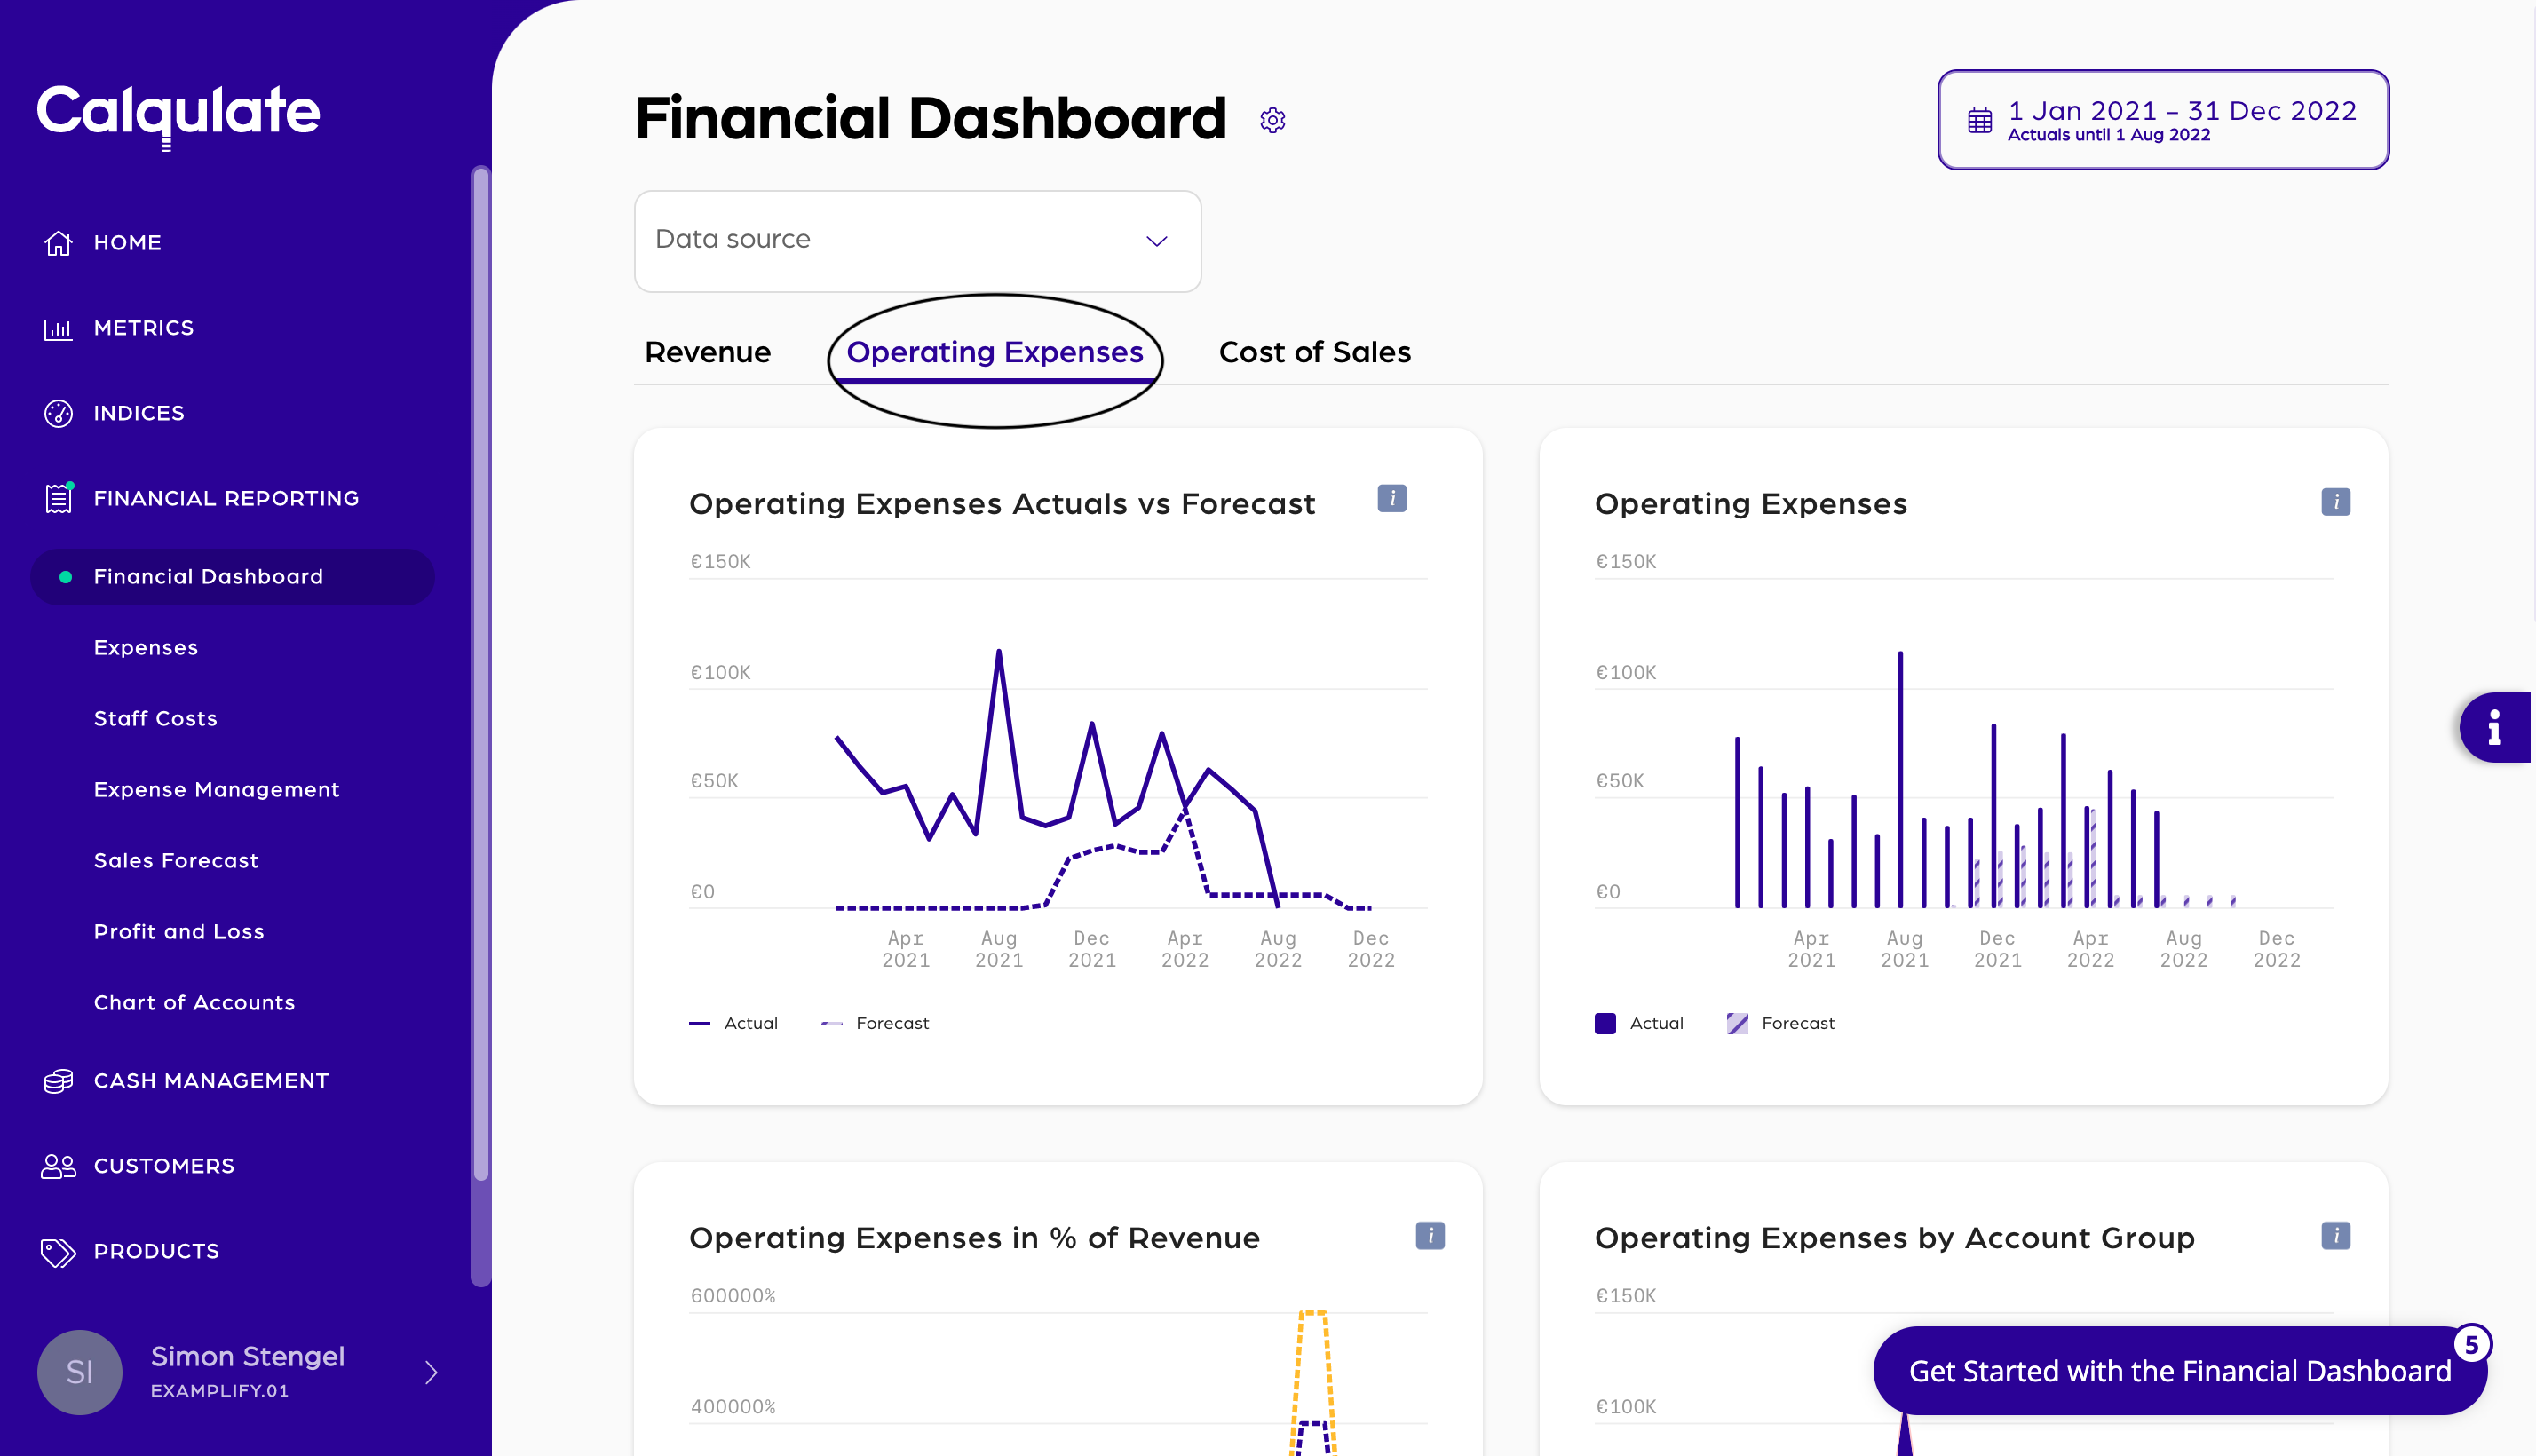
The second tab, deals with your Operating Expenses. You can forecast and compare versus actuals. Another useful function is to break them down by account groups or check the share of operating expense cost of the total revenue. If you want to dive into those metrics deeper, check out the tracking categories feature.
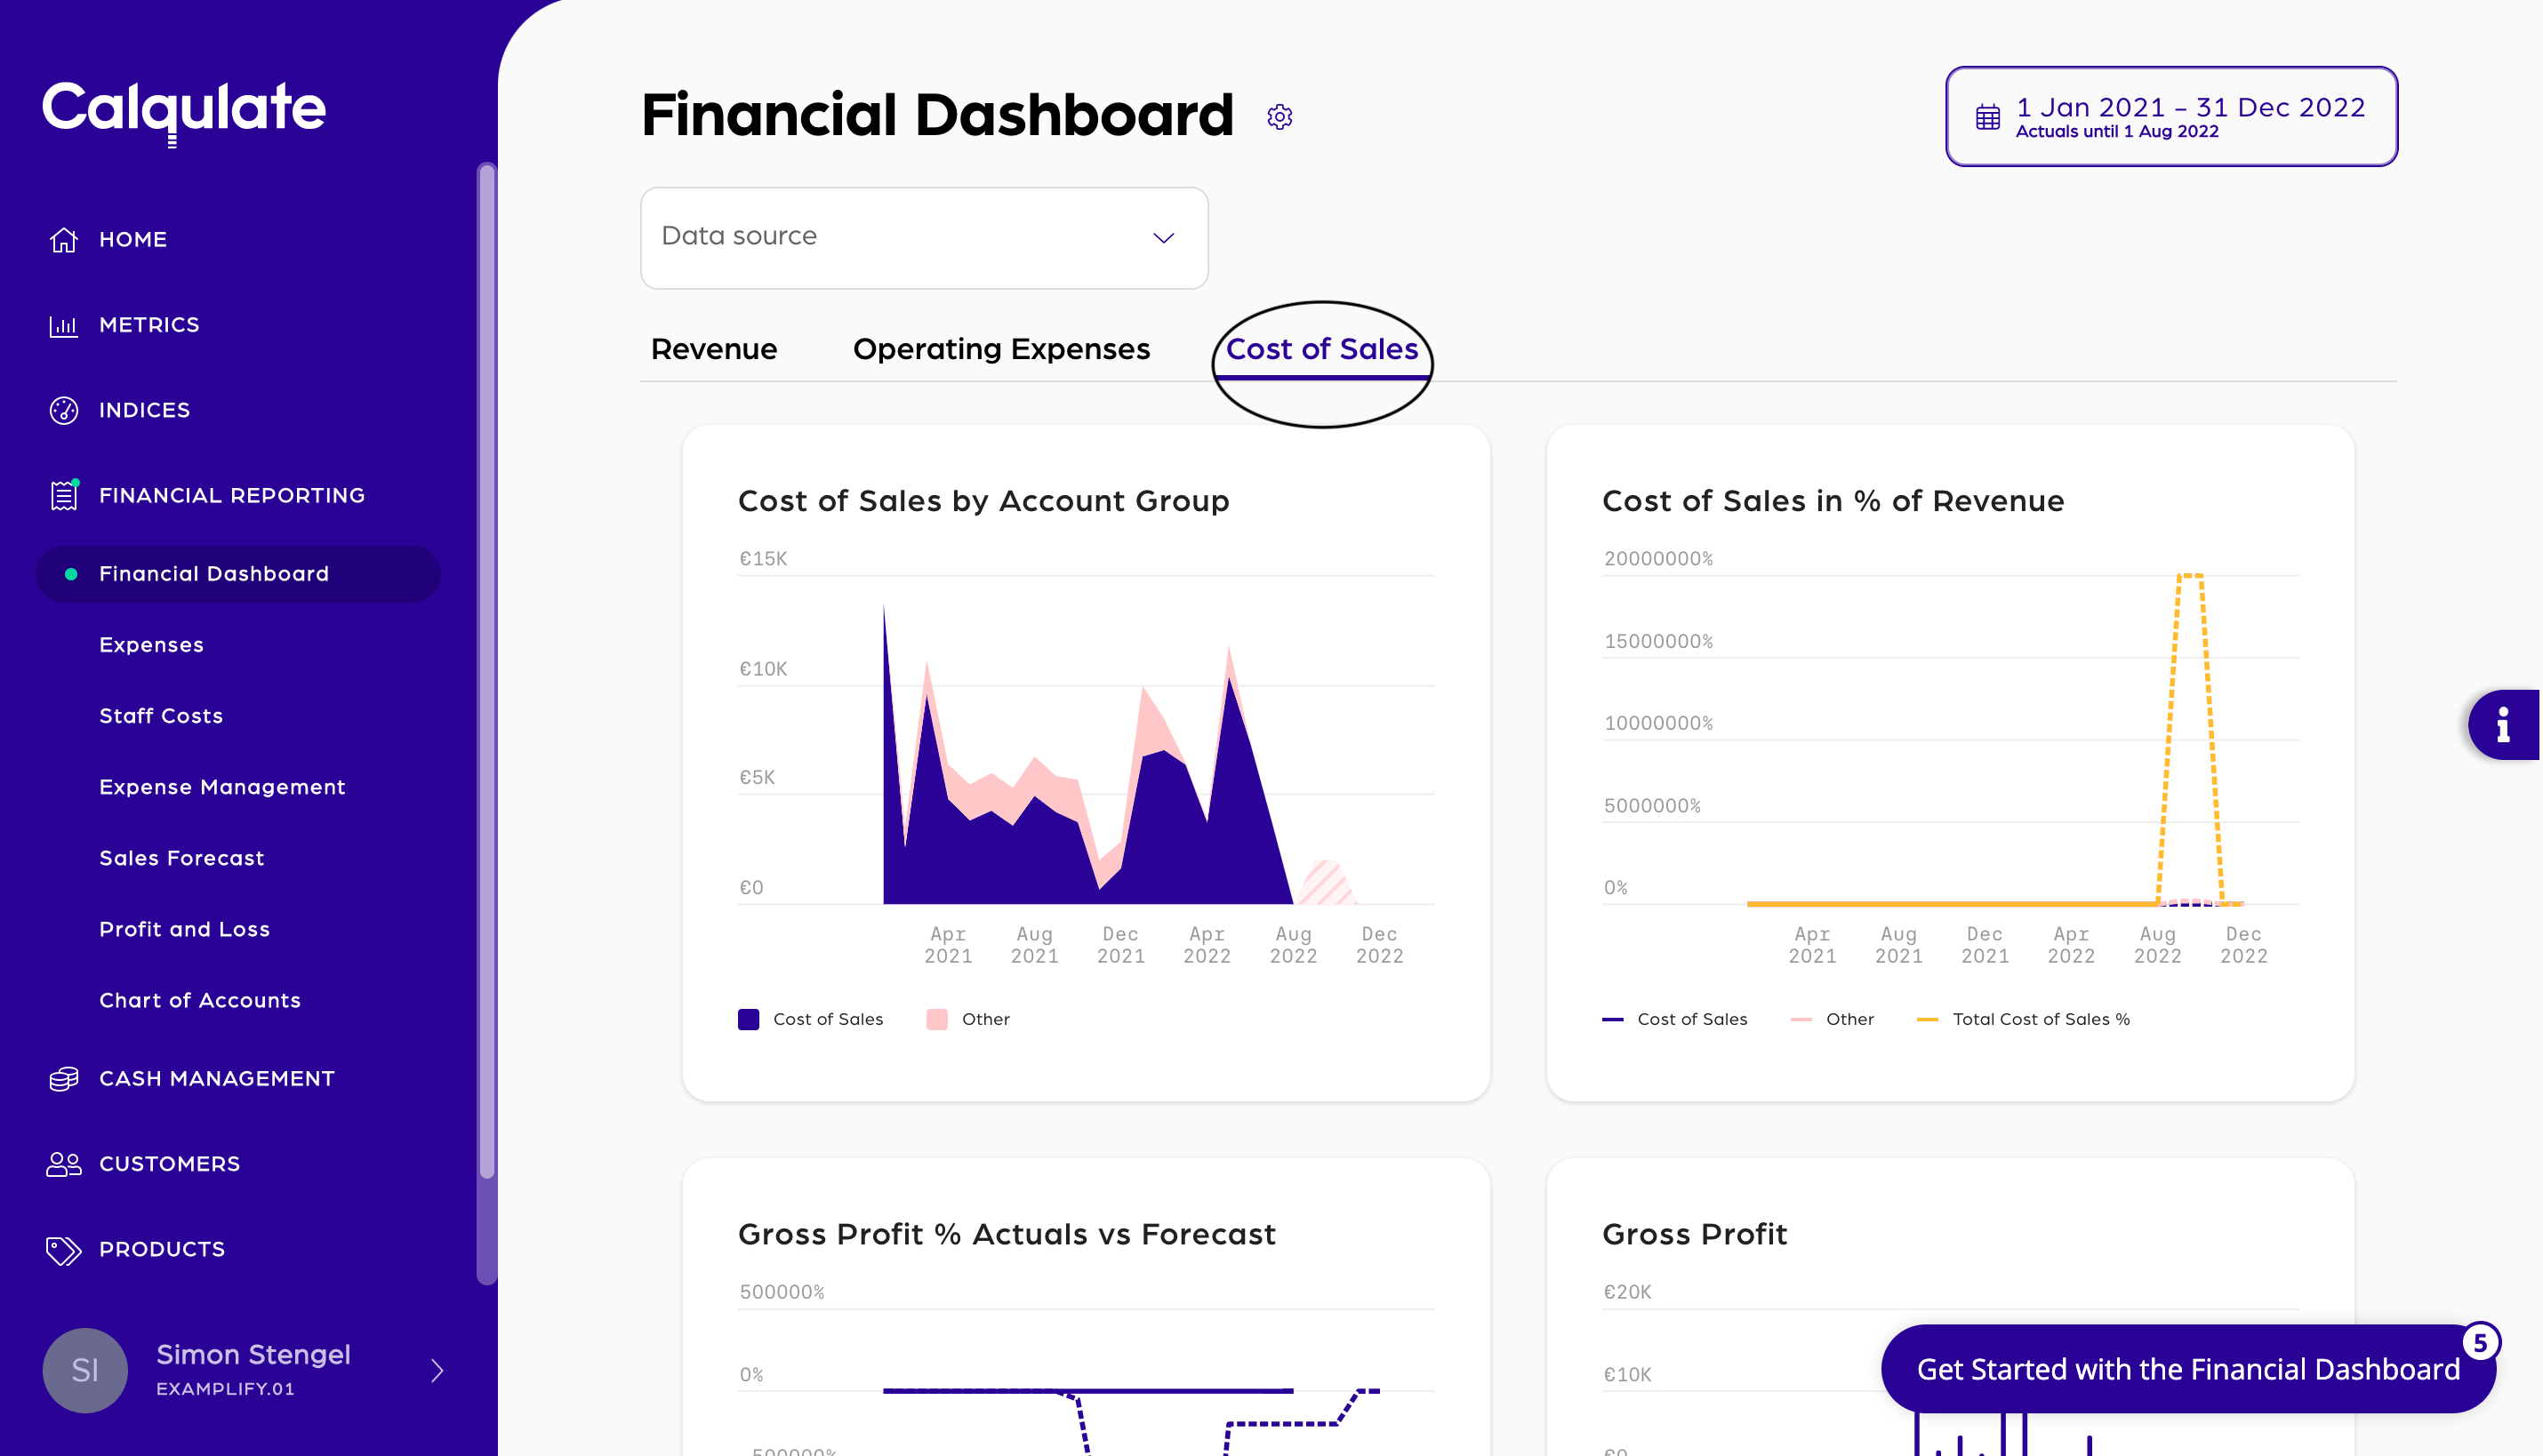
The Cost of Sales tab helps you to break down your costs. You can breakdown your cost of sales by account groups, you can monitor the share of cost of sales of the revenue, track your gross profit and more. For this tab we offer the tracking category feature, as well.
Updated almost 4 years ago
What’s Next
Those articles might help you setting up your Financial Dashboard