Projected Fit Score
The Projected Fit Score is a feature of Calqulate that helps to identify high quality investment opportunities according to the investment thesis and deal criteria of the Investor or Lender.
The Projected Fit Score compares the deal criteria of an Investor/Lender to the target company's financial and non-financial data. Thereby the Projected Fit Score helps one to identify the best deal faster and automate opportunity analysis. For more information about the deal criteria, read this article.
Where to find the Projected Fit Score?
The projected fit score is accessible via the Opportunity list. This can be opened from the left-hand menu Opportunities. Clicking on the desired company will open the company profile that also includes the projected fit score.
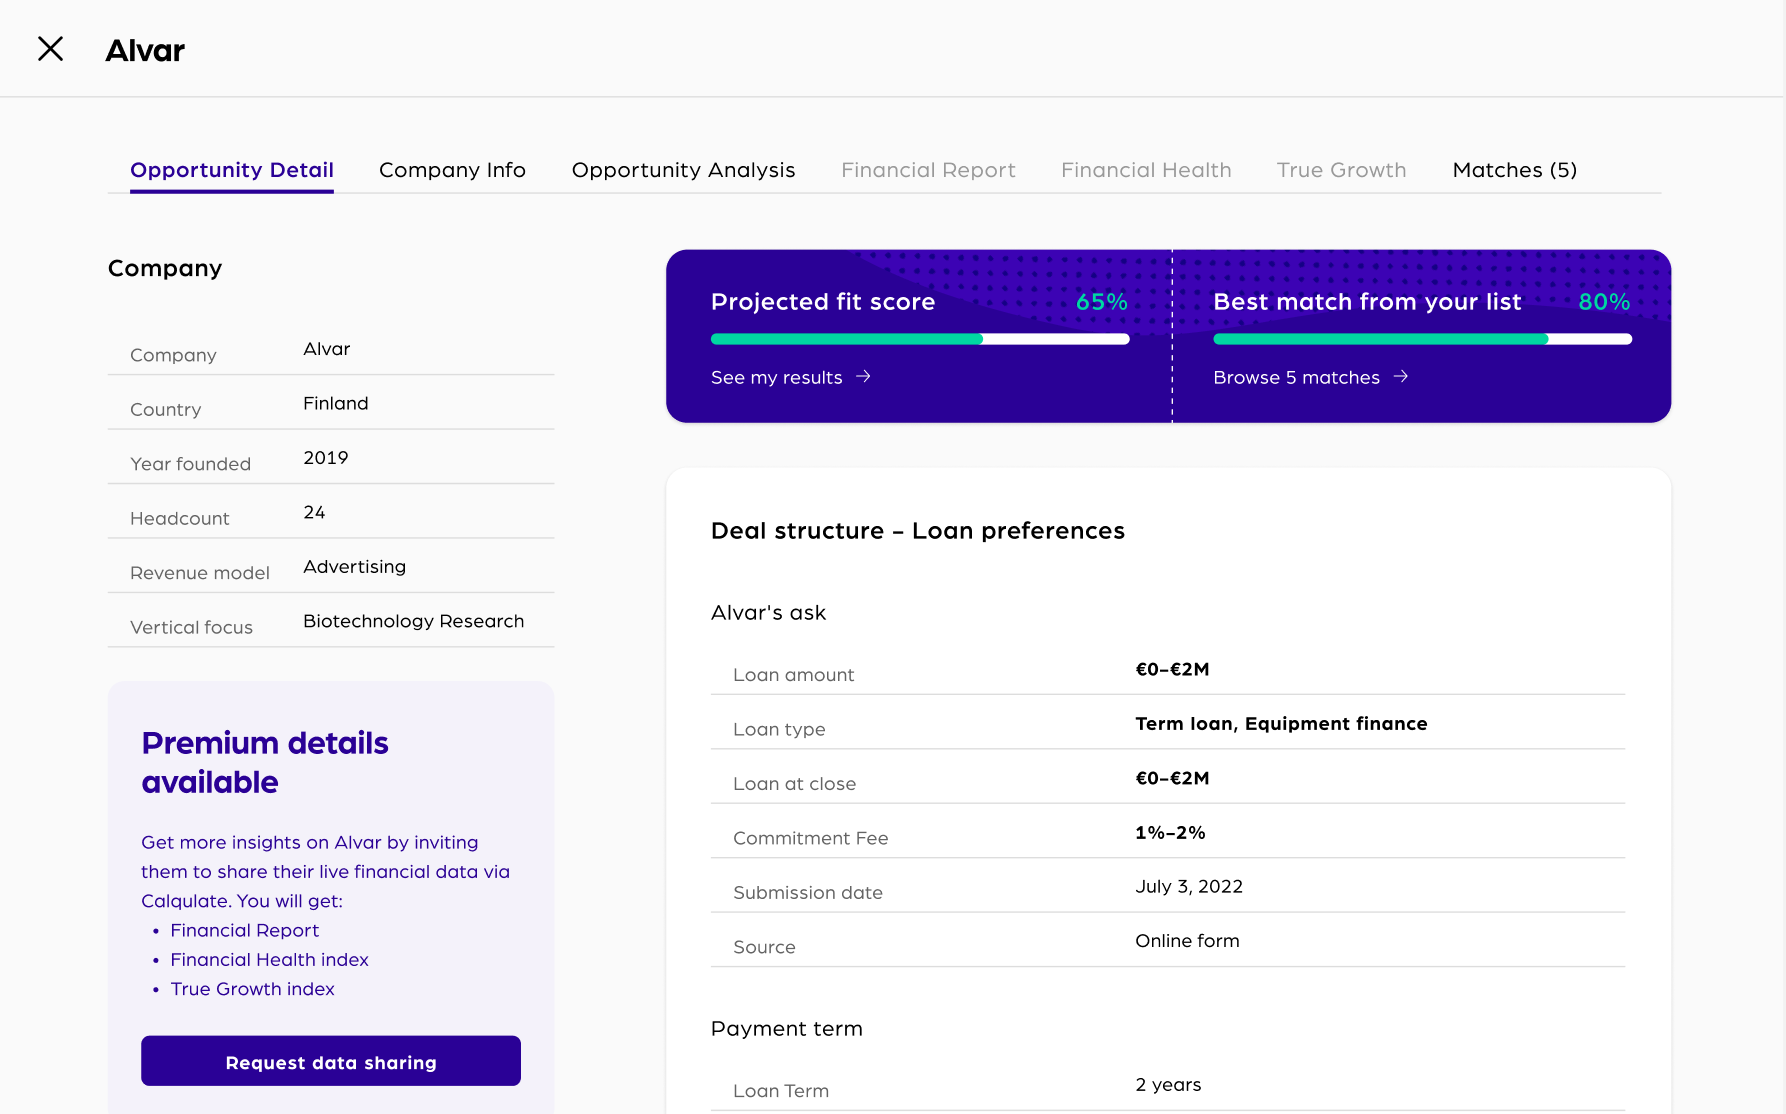
The Projected Fit Score is located in the Opportunity Detail tab.
Two different Projected Fit Scores are visualized:
- The first Projected Fit Score is for own organization based on your organization's deal criteria
- The second Projected Fit Score is the "Best match from your list" and it displays the best score based upon the deal criteria of your Investor & Lender list. You can consider this as a matchmaking score for potential syndicates.
How is the Projected Fit Score calculated
The deal criteria are compared to the target company's financial and non-financial data, including the equity/loan preferences of the target company. This is done by dividing the number of met criteria by the number of unmet and met criteria. From this a percentage number is created.
For example:
The Investor/Lender is looking for the following investment opportunities:
- Industry: Advertising, Sports, SaaS
- Financial Health Index: minimum 50%
- Monthly recurring revenue: minimum €60,000
- Lifetime Value to Customer Acquisition Cost ratio: minimum 3
- Lifetime value: minimum €1,000
- Growth rate: miminum 20% Year-on-Year
The target company's financial and non-financial are the following:
- Industry: SaaS
- Financial Health Index: 60%
- Monthly recurring revenue: €85,000
- Lifetime Value to Customer Acquisition Cost ratio: 1.4
- Lifetime value: €500
- Growth rate: unknown
Thereby three criteria are met:
- Industry
- Monthly recurring revenue
- Financial Health Index
Two criteria are not met:
- Lifetime Value to Customer Acquisition Cost ratio
- Lifetime value)
One criteria is missing:
- Growth rate
The calculation for the projected fit score is thereby 3/(3+2)*100 which results in a projected fit score of 60%.
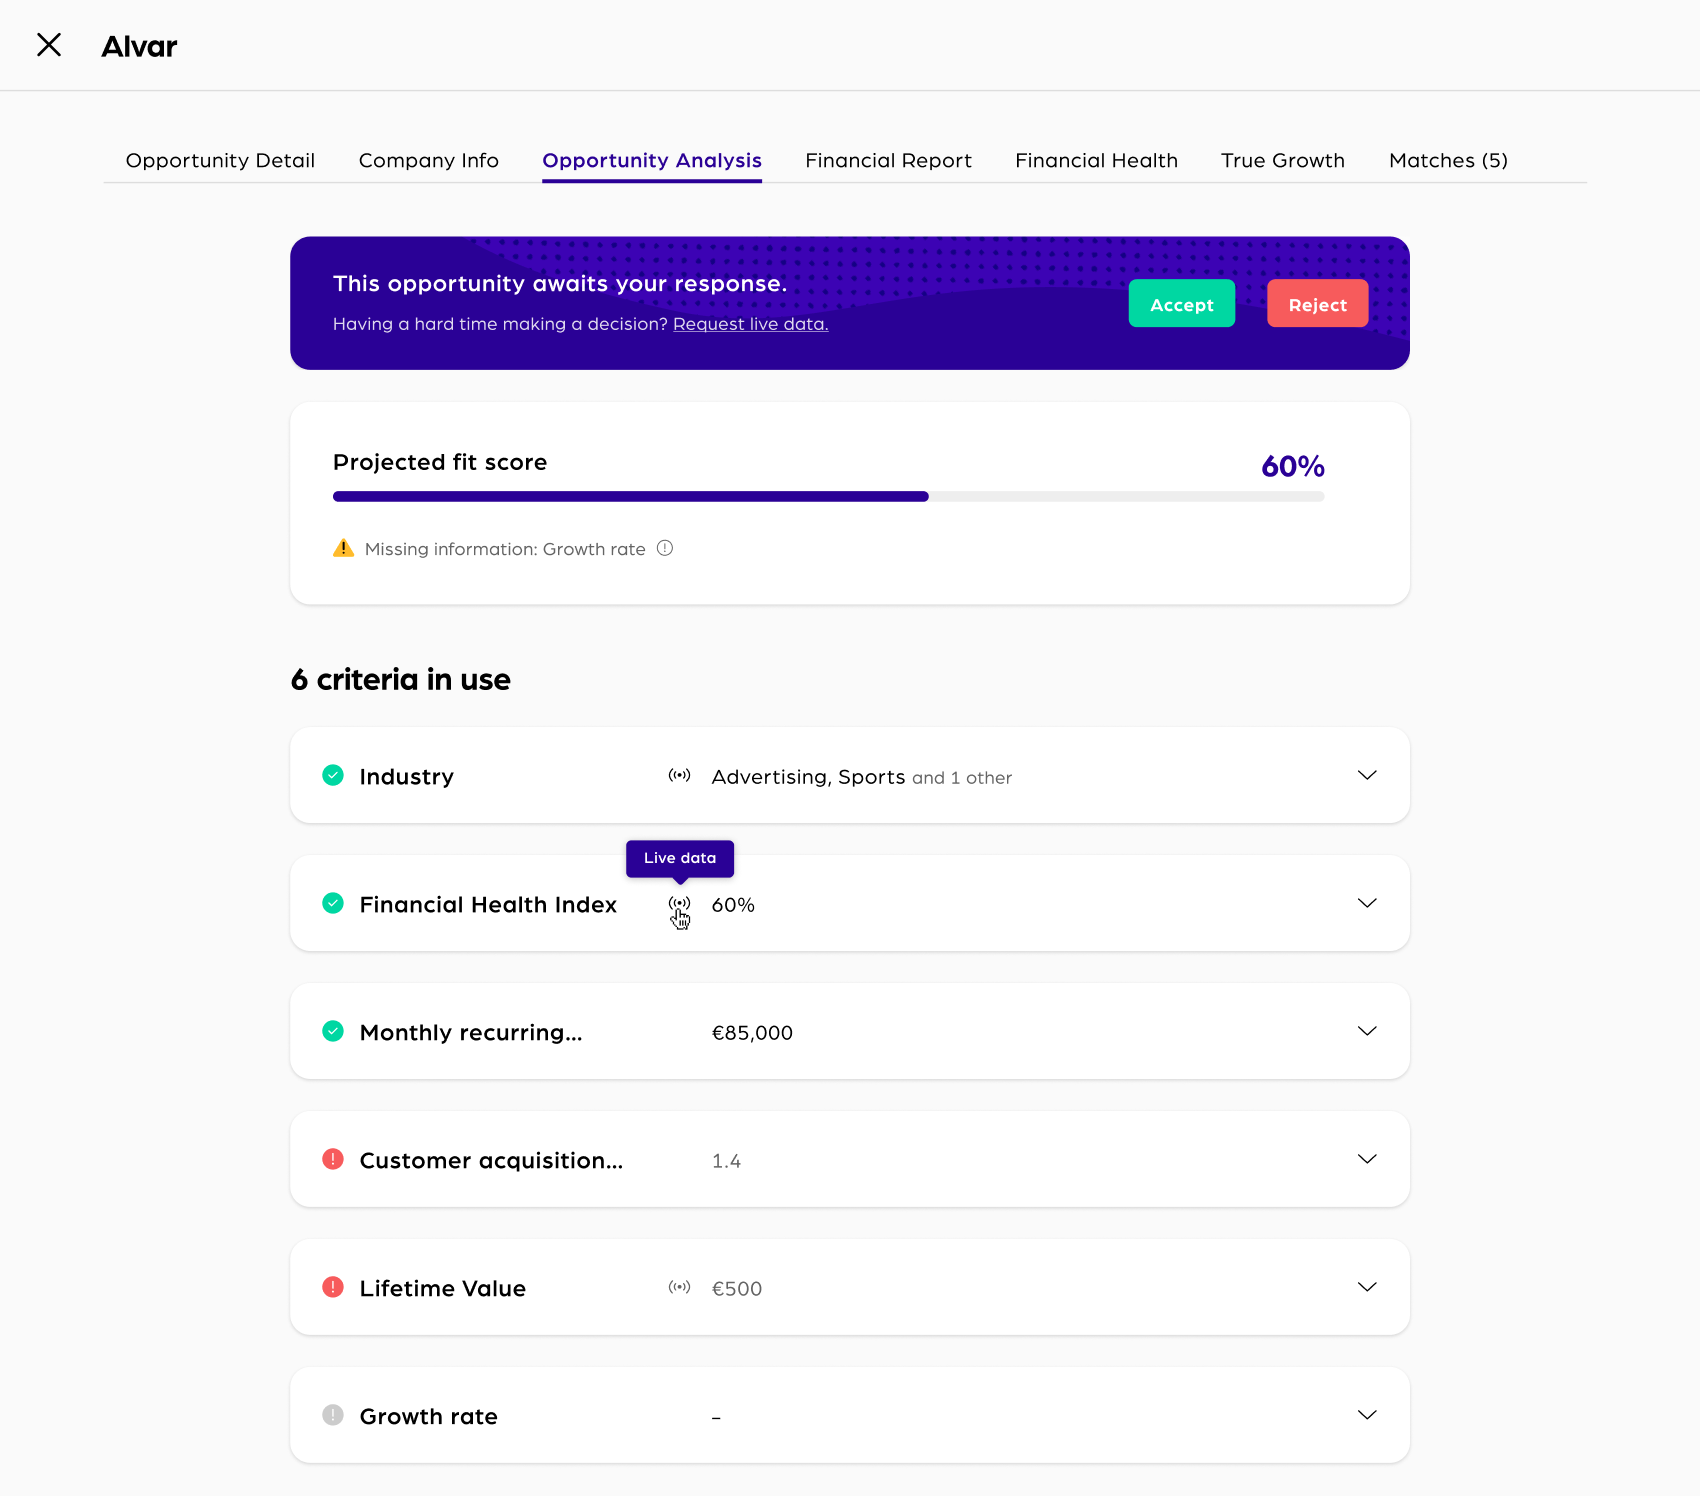
Data that is coming from live financial data sources is indicated with a radio wave icon next to its name. If there is not live data available, the process of requesting live data sharing is explained in this article.
The Investor/Lender can now decide if they want to Accept or Reject the opportunity by clicking the respective field.